
Financial LLM
16 Best Automated Reporting Tools
Discover 16 top automated reporting tools to streamline data tracking, boost efficiency, and simplify your reporting process—all in one list.

• Grata vs Sourcescrub
• Ibm Watson vs ChatgptAutomated reporting tools are transforming the way financial professionals handle data. Consider being able to generate accurate, detailed reports in a fraction of the time it currently takes you. Sounds too good to be true? Well, it’s not. With the right automated reporting software, this can be your new reality. In this guide, we’ll explore how these tools can help you write and research faster with AI so you can get back to focusing on what matters – making informed financial decisions. Meet Otio's AI research and writing partner, a game-changing Financial LLM tool designed to help you write and research faster with AI.
This powerful assistant will enable you to equip the full potential of automated reporting tools, allowing you to achieve your objectives with ease.
Table Of Contents
How Does Automated Reporting Work

Automated data reporting is the process of generating reports without manually entering all the data. Instead of manually collecting data, updating charts, and formatting layouts, a system takes care of it for you. You set up the report once and decide what data it needs, how it should look, and how often it should be updated. After that, the system retrieves new data and automatically generates the report.
This can occur on a schedule when specific conditions are met, or whenever someone requires it. In this guide, when we talk about automated reporting, we mean fully automated reporting. That means the report is connected directly to the data source. Therefore, there’s no need to upload new data or manually enter numbers. Some tools update a chart automatically when you change the data by hand, but that’s not what we’re referring to here. We’re talking about a setup where the data updates itself, and the report follows automatically.
Compared to manual reporting, it saves time and reduces the chance of errors. You don’t have to worry about using outdated data or missing a step in the process. Additionally, it facilitates the sharing of consistent, up-to-date insights across your team or organization. Automated reporting can range from sending a weekly sales update to generating personalized reports for hundreds of clients simultaneously. The key idea is the same: less manual work more reliable results. Here are the core components that make automated reporting work:
Data integration
This is how the system connects to your data. It can pull data from spreadsheets, databases, APIs, cloud platforms, or business applications. A live connection ensures that your reports are always based on the latest data, eliminating the need for manual updates.
Data processing & transformation
Before reporting, raw data often requires cleaning, filtering, or reshaping. This step may involve calculations, combining sources, or applying logic to make the data more meaningful. Some tools handle this natively, while others rely on outside tools or scripts.
Report templates & design
This is where the visual structure of the report comes in: charts, tables, text, and layout. Some tools offer basic formatting, while others specialize in creating flexible and professional-looking reports. Templates allow you to reuse the same structure with new data.
Automation logic
This controls when and how reports are generated. It could be time-based (such as a weekly report), user-triggered, or event-driven (such as when a number crosses a threshold). Effective automation ensures that reports are generated efficiently, eliminating the need for manual intervention.
Output & distribution
Finally, the report needs to be shared. This could mean a downloadable PDF, an embedded view on a platform, or an automatic email sent to a list of recipients. The distribution also includes permission settings, ensuring that only the intended recipients view the report.
Benefits of Automated Reporting
Automated reporting tools are transforming the way organizations handle data and reporting. By automating the process of data collection, analysis, and reporting, businesses can gain insights faster and make more informed decisions. These tools are designed to integrate with various data sources, enabling seamless data extraction and report generation.
1. Increased Efficiency and Productivity
One of the most significant benefits of automated reporting tools is increased efficiency. By eliminating manual tasks associated with reporting, such as data entry and formatting, employees can focus on more strategic activities. This not only improves productivity but also reduces the time it takes to generate reports, enabling faster and more informed decision-making.
2. Enhanced Accuracy and Consistency
Manual reporting processes are prone to human error, which can lead to inaccurate data and misinformed decisions. Automated reporting tools reduce the risk of mistakes by standardizing data collection and report generation. This ensures that reports are consistent and reliable, boosting confidence in the information presented.
3. Cost Savings
Automating reporting processes can lead to significant cost savings for organizations. By reducing the time and resources required to produce reports, businesses can lower operational costs and increase profitability. Additionally, automated reporting can help identify areas of waste and inefficiency, further contributing to cost reduction.
4. Improved Data Visualization and Analysis
Automated reporting tools often come with advanced data visualization capabilities, making it easier to interpret complex data sets. Interactive dashboards and charts allow users to explore data and uncover trends, enabling more informed decision-making. Furthermore, automation can facilitate real-time reporting, providing up-to-date insights to support dynamic business environments.
5. Scalability and Flexibility
As organizations grow, their reporting needs become more complex. Automated reporting tools offer scalability and flexibility to accommodate changing requirements. Whether it’s expanding data sources, increasing report frequency, or customizing report formats, automation can adapt to meet the needs of any business.
6. Better Compliance and Governance
Automated reporting helps organizations maintain compliance with industry regulations and internal policies. By ensuring that data is accurately captured and reported, businesses can avoid costly fines and reputational damage. Additionally, automated audit trails provide transparency and accountability, supporting effective data governance.
7. Enhanced Employee Satisfaction
Repetitive manual reporting tasks can be tedious and demotivating for employees. By automating these processes, organizations can improve job satisfaction and reduce turnover. Employees are freed up to focus on more meaningful work that adds value to the business.
Related Reading
• How to Improve Finance Processes
• Financial Reporting Challenges
• Financial Forecasting Techniques
• Financial Data Extraction
• Financial Statement Analysis Techniques
• How to Forecast Budget
• Market Research Challenges
• How to Do a Cost Analysis
• AI Financial Modeling
How to Choose an Automated Reporting Tool

Choose a tool that fits your stack and your daily rhythms: pick one that's compatible with your test frameworks and CI, minimizes runtime overhead, and provides templates you can actually hand off to nontechnical users. The right choice is the one that replaces repetitive work with governed, repeatable outputs so teams stop rebuilding the same report every month.
Which frameworks does it need to support?
Match the tool to the frameworks you already use, not the ones you might use someday. If your tests generate JUnit, TestNG, or Mocha artifacts, verify the reporting tool ingests those formats natively or via stable adapters. A mismatch forces you to build and maintain glue code that will fail during upgrades, which is where hidden maintenance hours live.
How will it fit into my CI/CD pipeline?
Demand a clean integration story: native plugins for Jenkins, GitLab CI, or CircleCI, or a webhook-based API you can script once. If report generation triggers inside the pipeline, look for parallelized exporters and incremental reporting, so you don’t add a bottleneck to every build.
How much customization do we actually need?
Stakeholders ask for new views all the time, and every added view multiplies templates, approval steps, and version branches. Treat customization as a controlled capability: prefer tools that offer templated layouts with parameterized sections, so you can deliver new slices without hand-editing the report each month. That way, you avoid turning a single monthly report into dozens of bespoke deliverables.
Will this slow my tests down?
Performance matters. Choose tools that decouple reporting from execution, exporting results asynchronously or streaming them to a dedicated reporting worker, and test execution becomes hostage to render time. In practice, that simple separation keeps test feedback fast and your build times predictable, which is crucial when shipping weekly.
How easy is it for the team to adopt?
Look for low-code editors, sensible defaults, and role-based access, so analysts and managers can tweak visuals without pulling engineering into every change. Start small, roll out read-only connectors to validate fit, then promote users to authoring roles once the templates prove reliable. This staged adoption prevents the paralysis that comes from too many options and keeps token and maintenance costs under control.
What will it cost me, really?
License fees are only part of the picture. Include onboarding hours, the cost to map and validate each data source, and the time spent updating templates when stakeholder requirements change.
For many teams, the math becomes obvious: according to Ready Logic (2025), "75% of agencies reported a significant reduction in reporting time after implementing automated tools," which underscores that buying the right automation shrinks recurring labor, not just headline spend.
Likewise, the practical impact often scales with client or report volume, as shown by Ready Logic (2025): "Automated reporting tools can save up to 20 hours per month per client," making it easier to justify upfront migration work when you map those savings across teams.
How good are the reports at answering questions?
Demand pass/fail rates, error logs, traceability to source test cases, and exportable audit trails. Reports should link back to the raw artifacts so you can verify numbers without rebuilding the pipeline. If a vendor can show a consistent lineage from raw result to published slide, you know the platform treats data governance as first class rather than an afterthought.
What breaks as you scale?
This pattern appears across QA and analytics: an elegant demo becomes brittle once you add more stakeholders, more data sources, and more regulatory checks. What fails is not features, it is entropy, the slow growth of exceptions and forks. Choose tools that offer templating, parameterized transforms, and immutable audit logs so you can scale without the report fracturing into unique, unmaintainable one-offs.
Most teams manage monthly reporting with ad hoc scripts and email threads because it is familiar and requires no new approvals, and that works at first. As stakeholders multiply and timelines compress, those scripts fail, credentials break, and reconciling versions consumes the time you meant to recover. Platforms like Otio provide low-code templating, automated data transforms, and distribution with audit trails, giving teams a governed way to swap manual assembly for repeatable, auditable outputs while keeping control of who can edit templates and when.
Choosing a reporting tool is like buying a camera you never try in low light; the spec sheet looks good until you use it where it matters. The next part reveals the one practical skill that separates useful tools from distractions, and why editors will notice it first.
16 Best Automated Reporting Tools
The best automated reporting tools are those that free teams from manual assembly by pairing low-code automation with robust connectors and governance, ensuring reports are repeatable, auditable, and actually trusted. Pick tools based on the work they replace, not on feature lists: some excel at pulling many marketing sources, others at securing finance workflows, and a few combine AI-assisted synthesis with strict audit trails.
1. Otio, AI-native research workspace
Purpose
Automates research capture, knowledge management, and draft report creation for researchers and knowledge workers.
Description
Otio pulls articles, PDFs, videos, and bookmarks into a single workspace, extracts salient points, and scaffolds drafts so researchers spend less time hunting and more time thinking.
Key capabilities
AI-generated summaries and notes; source-grounded Q&A chat; scraping for unconventional sources; assisted report drafting and templating.
Pros
Cuts research friction and reduces simple human error in synthesis.
Cons
Advanced features need learning; AI drafts still require human validation for high-stakes decisions.
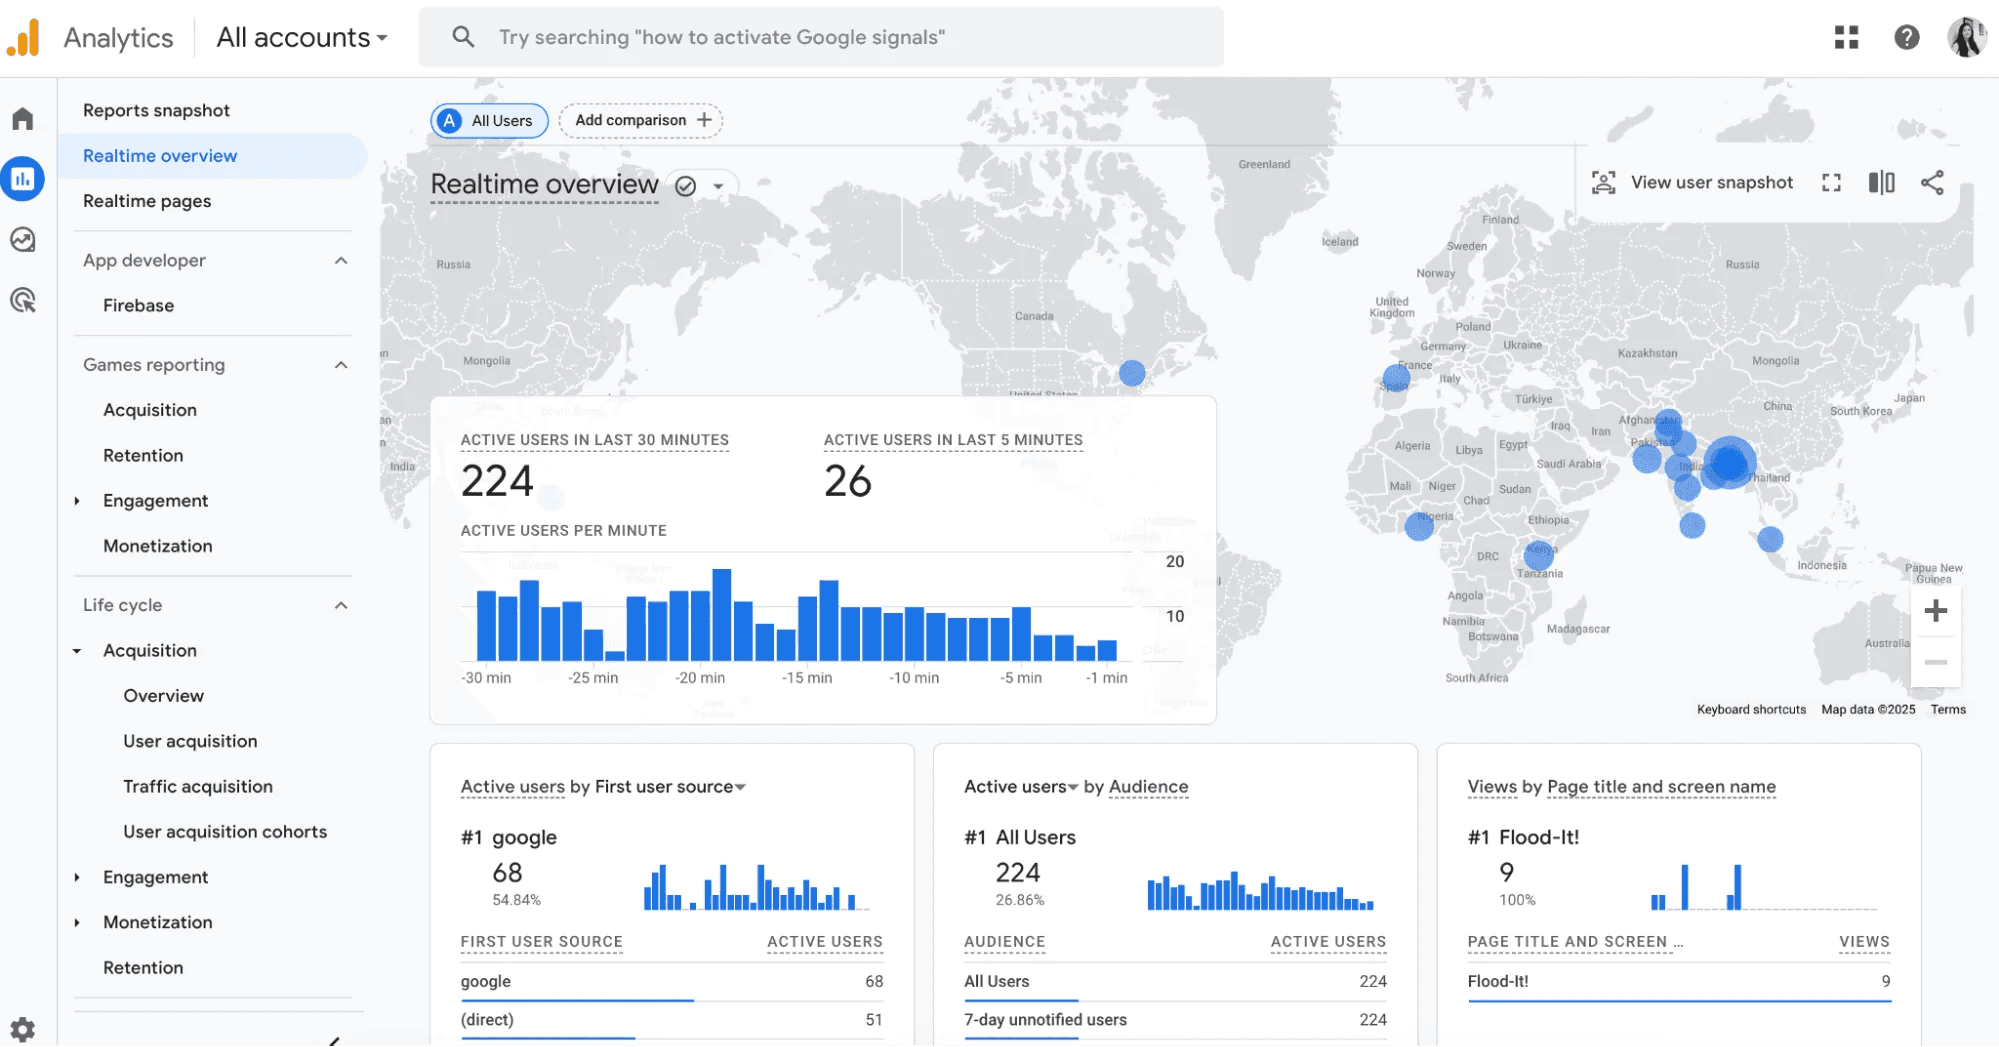
2. Google Analytics, web traffic reporting
Purpose
Monitors visitor behavior and campaign outcomes for digital marketing decisions.
Description
A classic web analytics engine that tracks sessions, funnels, and acquisition sources to show where traffic comes from and how it converts.
Key capabilities
Real-time monitoring, custom dashboards, alerts, and integration with Google Ads and Search Console.
Pros
Free and ubiquitous, strong audience segmentation.
Cons
Setup complexity for advanced tracking; limited out-of-the-box predictive insights.
3. Looker Studio, customizable dashboards and connectors
Purpose
Builds bespoke dashboards from a very wide set of connectors.
Description
Looker Studio lets teams craft interactive visualizations and scheduled reports that pull from many sources without heavy engineering.
Key capabilities
Prebuilt visualization templates, filters, and drill-downs, scheduled distributions, and collaborative editing.
Pros
Cost effective and highly integrable.
Cons
Advanced visualizations require manual tweaking and a steeper learning curve for complex joins.
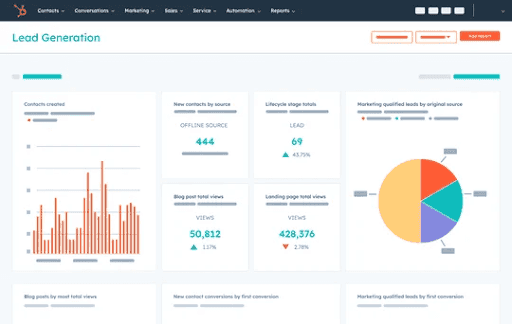
4. HubSpot, reporting automation and CRM analytics
Purpose
Automates marketing, sales, and customer reporting through centralized dashboards and real-time CRM-connected analytics.
Description
HubSpot Reporting Dashboards help teams consolidate data from marketing, sales, and customer interactions into customizable reports and dashboards. Instead of manually compiling spreadsheets, teams can automate reporting workflows, track KPIs in real time, and visualize performance across campaigns, pipelines, and customer journeys.
Key capabilities
HubSpot Reporting Dashboards provide customizable dashboards that combine CRM, marketing, sales, and customer data into a single reporting view. Teams can automate report generation and sharing, track campaign and pipeline performance in real time, and use attribution reporting.
Pros
HubSpot Reporting Dashboards reduce manual reporting work by centralizing data from marketing, sales, and CRM systems into a single interface.
Cons
Some of HubSpot’s more advanced reporting and attribution features are only available in higher-tier plans. The platform also works best for organizations already using HubSpot’s broader ecosystem, since much of its value comes from having CRM, marketing, and sales data.
5. SolveXia, finance automation and validation
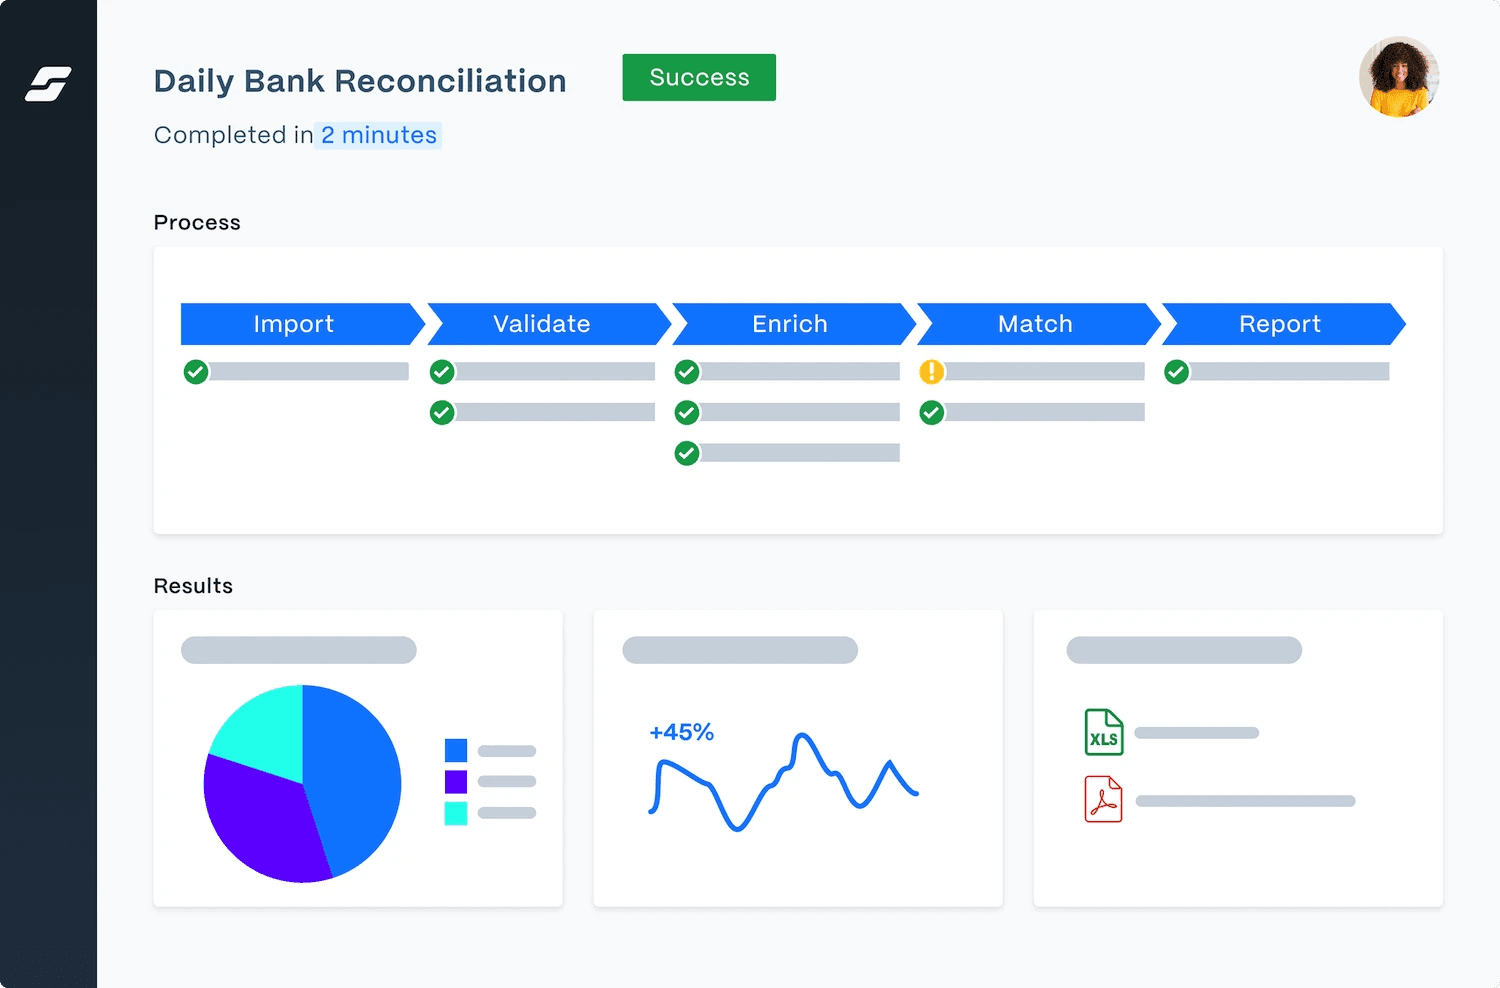
Purpose
Automates financial workflows, reconciliations, and reporting for accounting teams.
Description
SolveXia digitizes repetitive finance tasks, enforces audit trails, and generates repeatable reports with validation rules.
Key capabilities
Automated data reconciliation, customizable templates, workflow automation, audit logs.
Pros
Reduces manual errors and supports compliance.
Cons
Focused on finance use cases; implementation may need IT or specialist input.
6. Tableau, visual analytics and storytelling
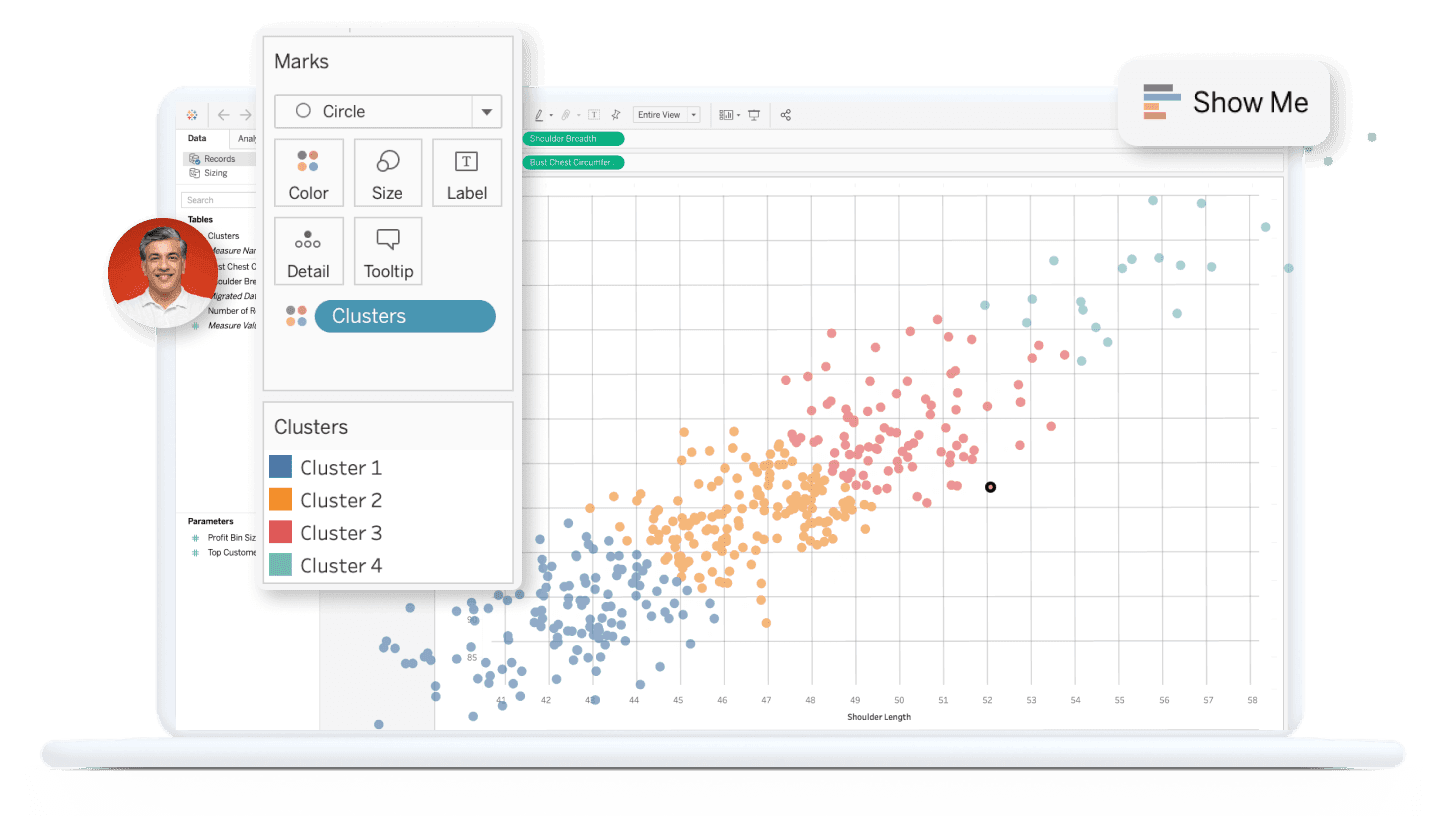
Purpose
Delivers enterprise-grade visualization and exploratory analytics for complex datasets.
Description
Tableau transforms raw data into interactive stories and dashboards for analysts who need deep, visual exploration.
Key capabilities
Drag-and-drop visual authoring, natural language queries, extensible connectors, enterprise security.
Pros
Excellent for large datasets and sophisticated visual analysis.
Cons
Higher licensing costs and a learning curve for advanced dashboards.
7. Power BI, Microsoft-centered reporting
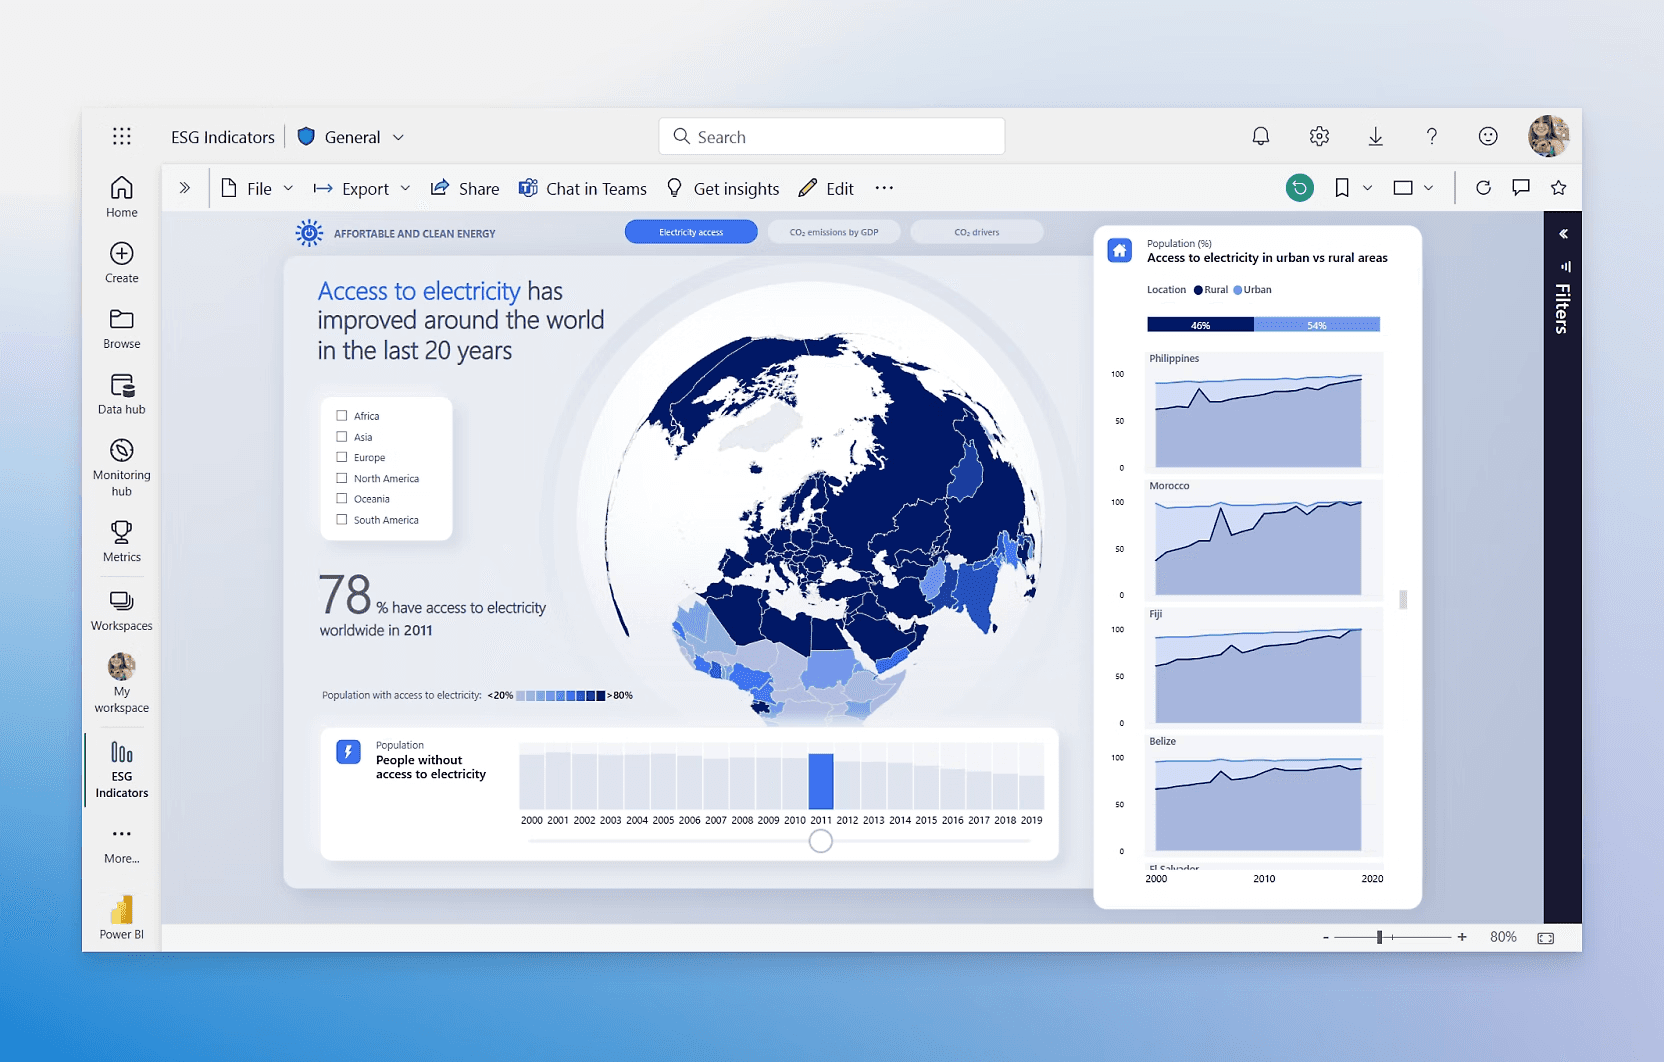
Purpose
Provides fast reporting and dashboards for organizations invested in Microsoft tools.
Description
Power BI integrates with Excel, SharePoint, and Teams, making it easy to build and share reports within the Microsoft ecosystem.
Key capabilities
Interactive reports, natural language queries, mobile-ready dashboards, and native Microsoft integrations.
Pros
Smooth integration with the Microsoft stack and accessible pricing.
Cons
Customization with non-Microsoft sources can be limited; advanced analytics often require DAX expertise.
8. Klipfolio, real-time cloud dashboards
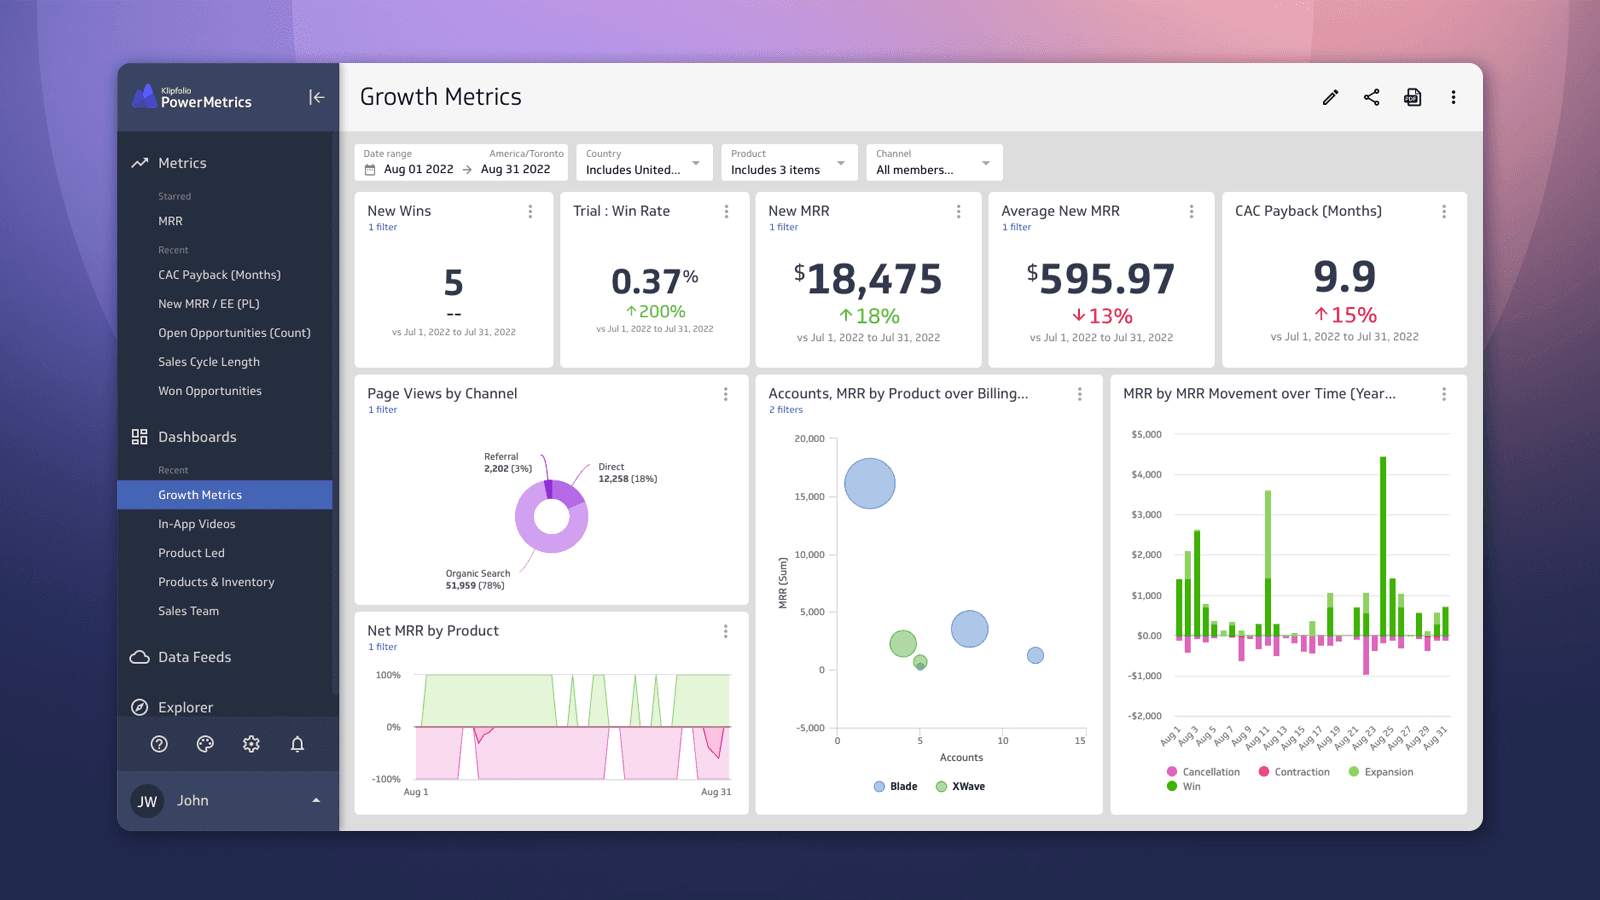
Purpose
Tracks real-time business metrics on customizable dashboards for small and mid-size teams.
Description
Klipfolio offers a lightweight, brandable dashboard tool that surfaces live KPIs without heavy setup.
Key capabilities
Large chart library, custom branding, training and support, live data refreshes.
Pros
Quick setup and easy for nontechnical users.
Cons
Not built for heavy analytics workloads or massive datasets.
9. Domo, collaborative real-time BI
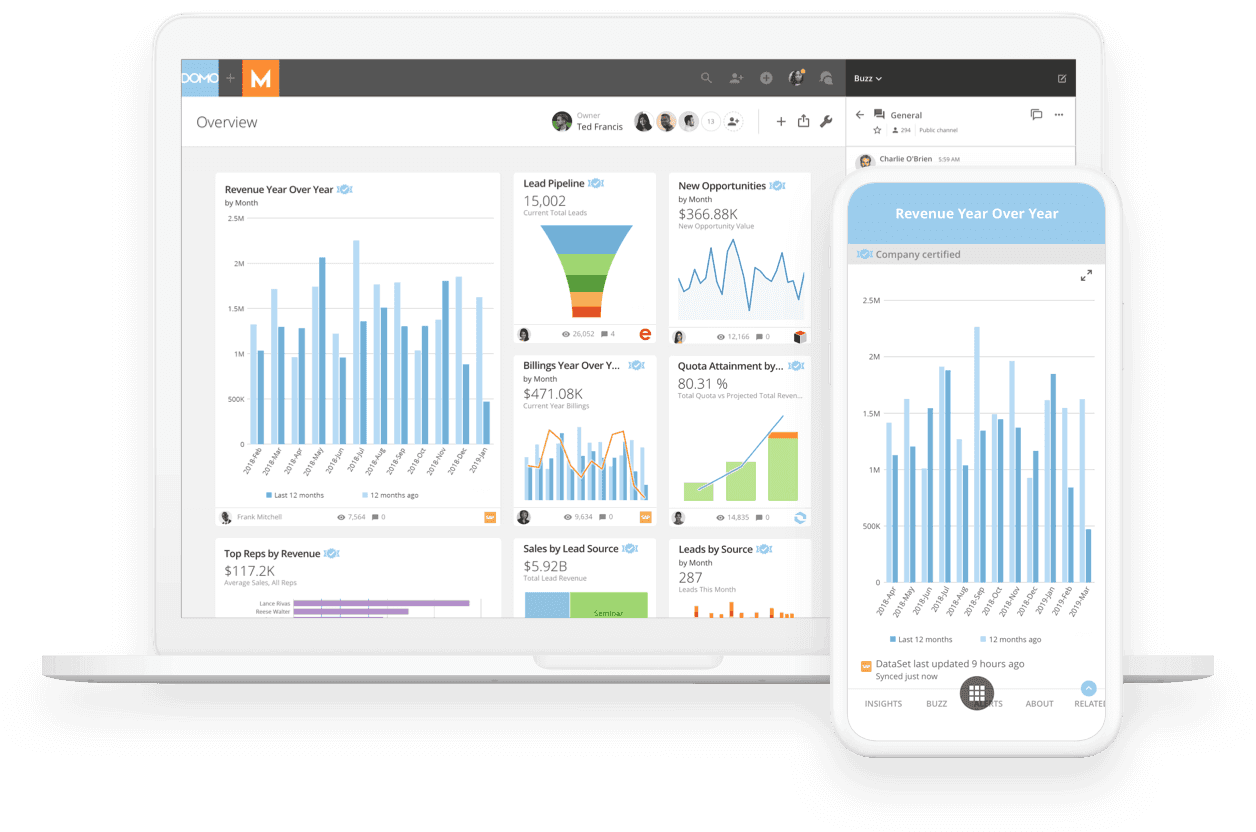
Purpose
Combines real-time data, predictive analytics, and team collaboration for cross-functional reporting.
Description
Domo brings many connectors and collaboration tools together so teams can act on insights quickly.
Key capabilities
Extensive connectors, customizable dashboards, embedded predictive analytics, and team collaboration features.
Pros
Real-time insight and strong collaboration.
Cons
Cost can be high for smaller organizations, and advanced analytics add complexity.
10. Qlik, report generation and distribution
Purpose
Supports data discovery with AI-enhanced reporting and broad distribution options.
Description
Qlik enables on-demand analysis and the automated delivery of insights in formats such as PowerPoint and PDF.
Key capabilities
Automated PowerPoint generation, subscription-based access, on-demand tabular analysis, and AI-augmented insights.
Pros
Robust output formats and enterprise reporting controls.
Cons
Set up complexity and licensing costs that may deter small teams.
11. OWOX BI, marketing attribution and analytics
Purpose
Automates marketing analytics and campaign attribution to inform spend decisions.
Description
OWOX BI centralizes advertising and sales data into unified reports that show which channels drive results.
Key capabilities
Prebuilt integrations with ad platforms, multi-channel performance reports, journey analysis, and scheduled distributions.
Pros
Marketing-focused automation that clarifies attribution.
Cons
Limited beyond marketing analytics, requires marketing data expertise.
12. Supermetrics, marketing data extraction, and pipelines
Purpose
Automates the extraction and consolidation of marketing data into BI tools or spreadsheets.
Description
Supermetrics moves raw marketing metrics into the reporting destination you choose, eliminating manual copy-and-paste.
Key capabilities
Automated data connectors, prebuilt templates, and data workflow customization.
Pros
Saves time on manual exports and works with many marketing platforms.
Cons
Primarily marketing-focused; pipeline setup still requires configuration and occasional maintenance.
13. Funnel, marketing data normalization
Purpose
Aggregates and normalizes data across hundreds of marketing platforms for unified reporting.
Description
Funnel centralizes disparate marketing sources, applies transformations, and feeds clean data to dashboards or warehouses.
Key capabilities
Support for 500-plus platforms, customizable visualizations, data transformation, and sharing.
Pros
Wide platform coverage and centralized, accurate datasets.
Cons
Mostly aimed at marketing teams, advanced transformations can need technical support.
14. Databox, goal-driven dashboards and scorecards
Purpose
Tracks performance, goals, and KPIs with fast, shareable dashboards.
Description
Databox focuses on goal-oriented reporting, letting teams set targets and receive reminders and live-status updates.
Key capabilities
Scheduled reports and reminders, public sharing of live reports, custom branding, reusable templates.
Pros
Very user-friendly and quick to implement.
Cons
Limited for deep analytics; best for small to mid teams and executive scorecards.
15. Improvado, marketing ETL and reporting at scale
Purpose
Processes marketing data at scale, providing clean pipelines to BI and reporting tools.
Description
Improvado extracts, normalizes, and transforms marketing data into unified feeds ready for visualization.
Key capabilities
Automated data processing, custom dashboards, and connectors to BI platforms.
Pros
Handles complex marketing stacks and scales for large teams.
Cons
Costly for smaller teams and focused on marketing use cases.
16. Sisense, embeddable analytics and reporting optimization
Purpose
Delivers embedded analytics, automated reporting, and flexible visualization across sources.
Description
Sisense offers deployable analytics, including templates and embedding options, for product- or vendor-facing reports.
Key capabilities
Extensive visualization templates, collaboration tools, embedded analytics, and scalable deployment.
Pros
Highly scalable and flexible for internal and external reporting.
Cons
Complex to implement for beginners and more expensive at the enterprise scale.
6 Tips for Automated Reporting

1. Use Otio
Otio provides one AI-native workspace for researchers.
It helps them
Collect a wide range of data sources, from bookmarks, tweets, and extensive books to YouTube videos.
Extract key takeaways with detailed AI-generated notes and source-grounded Q&A chat.
Create draft outputs using the sources you’ve collected.
Otio helps you transition from the reading list to the first draft more quickly.
2. Automatically track data
You can’t analyze data until you’ve gathered it. That’s why a CRM can track critical data for you—and it can do it automatically. You can track leads as they move through the sales pipeline. You can also automatically attribute each lead to the specific marketing and sales channels that contributed to their conversion. This data can come from various sources, including your website.
3. Set up automated reports
CRMs can also help you automate data analysis by generating automated data reports. A data report is a summary of the data received over a specific period, often highlighting key metrics, patterns, or trends. Some of the metrics your data reports might highlight include:
Conversion rate
Customer demographics
4. Share reports with your team
Very often, you won’t just want to look at your data—you’ll want to present it to your team or the decision-makers at your company. If that’s the case, you don’t have to worry about compiling that data into a presentation-friendly format. You can also share reports with other team members right in your account, which means you don’t even have to download or export data if you don’t want to.
5. Utilize data visualization tools for enhanced insights
Advanced data visualization tools integrated into your CRM are invaluable assets that simplify the interpretation of complex data sets. By leveraging these data reporting tools for automated data analysis, businesses can more effectively identify patterns and trends. These tools open new opportunities for organizing data and maximizing the potential of your CRM. They allow teams to visualize key metrics at a glance, making it easier to draw actionable insights that inform strategic decisions.
6. Implement machine learning algorithms for predictive analysis
Incorporating machine learning algorithms into your CRM can significantly enhance automated data analysis capabilities. By analyzing past interactions and behaviors, businesses can create detailed customer segments that enable more targeted marketing campaigns and personalized product recommendations. Predictive models can identify customers who are likely to churn, allowing companies to proactively engage them with special offers or customized communication to retain their loyalty. Additionally, historical sales data can be used to forecast future trends, providing crucial information for inventory management, marketing budget allocation, and sales strategy planning.
Related Reading
• Financial Analysis Tools
• Best AI Tools for Finance
• How to Improve Forecast Accuracy
• How to Write an Analysis Report
• Finance Automation Tools
• Finance Workflow
• Budget Variance Analysis
• AI to Analyze Calls
• Robotic Accounting Automation
• Private Equity Analysis Tools
Supercharge Your Researching Ability With Otio — Try Otio for Free Today
Otio is an AI-native workspace designed to streamline the research process for knowledge workers, researchers, and students. It addresses the issue of content overload by providing a platform that helps users collect, extract, and create information from a wide range of data sources. These sources include bookmarks, tweets, books, YouTube videos, and other online materials. By leveraging AI, Otio enables researchers to generate detailed notes, engage in source-grounded Q&A, and produce draft outputs based on the information they have gathered. This significantly reduces the time and effort required to go from a reading list to a first draft, making Otio an invaluable tool for anyone involved in research.
Related Reading
• Alphasense Alternatives
• Financial Modeling Tools
• AI Budgeting Tools
• Crunchbase vs Pitchbook
• Pitchbook Competitors
• Cb Insights vs Pitchbook
• Grata vs Sourcescrub
• Ibm Watson vs Chatgpt
• Microsoft Dynamics 365 Alternatives


