
Financial LLM
15 Best Financial Analysis Tools
Discover 15 top financial analysis tools to help you track performance, make smarter decisions, and improve your business insights.

Financial analysis tools are essential for dissecting company data, allowing you to create insightful reports and make informed decisions. Whether you're a student, professional, or investor, mastering these tools will give you a significant advantage in understanding financial statements, ratios, and models. In this guide, we'll explore the key financial analysis tools you need to know and how they can help you achieve your goals, such as writing and researching faster with AI. You may wonder how AI fits into financial analysis. Well, AI-powered tools like Financial LLM and the Otio AI research and writing partner can assist you in processing large volumes of economic data, automating repetitive tasks, and enhancing your analytical capabilities.
This means you can focus on interpreting the results and making strategic decisions, rather than getting bogged down in the details. With the help of AI, you'll be able to conduct financial analysis more efficiently and effectively than ever before.
Table Of Contents
Importance of Financial Analysis

The Shares Investment and Holding: Meeting Investor Expectations through Financial Analysis
A business demands financial analysis to satisfy investors who seek stock purchases or wish to sustain their equity investments. Organizations act as investment planning tools through financial statement assessments and performance tracking. Investors analyze official statements to determine prospective companies’ financial performance and growth potential. Financial analysis enables investors to discover high-return potential investments by assessing risk levels between different businesses.
Plans, Decisions, and Management: Strategic Planning Powered by Financial Analysis
Financial analysis is the main operational approach for businesses to manage and plan their monetary resources. Financial data evaluation identifies crucial threats and potential business growth possibilities that may impact the economic outcome. Business decision-making processes become more strategic through financial analysis, which enables the development of strategic plans and more efficient resource allocation. Evaluating financial statements allows businesses to identify methods that lower expenses while increasing earnings.
Providing Credit: Demonstrating Creditworthiness through Financial Analysis
Businesses demonstrate the value of financial statement analysis in their credit requests to lenders. Lenders assess a company's creditworthiness and investment risk through its economic analysis. The analysis enables lenders to determine whether to extend credit, the amount of credit, and the associated conditions.
Financial Analysis Helps in Assessing a Company’s Financial Health: Monitoring Performance and Identifying Opportunities
Financial statement analysis is essential for establishing a firm’s financial position. Organizations utilize economic data to pinpoint operational weaknesses and devise strategic plans that align with their financial objectives. Financial analysis also monitors a company’s monetary performance, revealing potential threats and opportunities. Companies utilize financial statement analysis tools to identify new investments while minimizing costs and making strategic choices to enhance their economic performance.
Related Reading
• How to Improve Finance Processes
• Financial Reporting Challenges
• Financial Forecasting Techniques
• Financial Data Extraction
• Financial Statement Analysis Techniques
• How to Forecast Budget
• Market Research Challenges
• How to Do a Cost Analysis
• AI Financial Modeling
5 Tips for Efficient Financial Analysis

1. Use Otio to Streamline Your Research Workflows
Content overload is a big issue for knowledge workers, researchers, and students. When trying to make sense of complex topics or gather data for analysis, many of us resort to using a mix of bookmarking tools, read-it-later apps, and note-taking software. This patchwork approach is inefficient and often leaves us struggling to find the information we need when we need it. Otio offers a better way. It provides a single, AI-native workspace where you can collect data from a wide range of sources, including bookmarks, tweets, books, and YouTube videos.
Otio then uses AI to generate notes and extract key takeaways from your sources. This not only saves you time, but also helps to ensure that you don’t miss any crucial details. You can even chat with Otio to ask questions about your data or get help with writing research papers and reports. In short, Otio can help you go from a disorganized pile of information to a well-structured analysis much faster.
2. Understand Your Company’s Strategic Context
Before analyzing financial data, it is essential to understand your company’s strategies and goals. This includes understanding what your product or service is, the industry in which you operate, who your target market is, and what your short-term and long-term objectives are. Having this context will help you interpret financial data more accurately, as you’ll be able to relate the numbers to your company’s specific circumstances. For example, if you know that your company is currently in a growth phase, you might expect to see higher-than-normal expenses as you invest in expanding your operations. Without this context, you might mistakenly conclude that your company is performing poorly.
3. Analyze Profitability and Risk Effectively
Analyzing financial statements involves examining various indicators, including profitability, liquidity, asset management, and risk. It’s not enough to simply understand what these terms mean – you also need to be able to critically analyze the data and compare it to previous periods to identify trends. For example, by comparing your company’s current profitability to that of previous years, you might discover that your profit margins are shrinking.
This could indicate increased competition or rising costs, both of which warrant further investigation. You should also compare your company’s financial performance to that of other businesses in your industry. This will help you determine whether any trends you’ve identified are unique to your company or part of a broader industry pattern.
4. Monitor Your Cash Flow Statement Closely
Your cash flow statement is one of the most important financial documents for your business. It shows you where your cash is coming from and where it’s going on a month-to-month basis. By understanding your cash flow, you can avoid potential insolvency by identifying cash shortages before they become a problem. This is especially important for smaller start-ups that may not yet be generating consistent profits.
5. Use Forecasted Financial Statements
Forecasting your company’s financial future may sound like a daunting task, but it can provide invaluable insights. By working with your accountant to prepare forecasted financial statements, you can make reasonable assumptions about your company’s future performance based on current trends and industry data. These forecasts can help you plan for upcoming challenges and identify opportunities for growth and improvement.
Challenges of Manual Financial Analysis

Manual financial analysis drains time that should be devoted to strategic thinking. According to INAA, 90% of accounting professionals report spending excessive time on manual data entry and reconciliation. The work compounds quickly: recording transactions, cross-referencing receipts, hunting for discrepancies across spreadsheets. What starts as a few hours becomes days lost to tasks that machines could handle in minutes.
The Hidden Cost of Data Entry
Every number you type manually carries risk. A misplaced decimal. A transposed digit. A formula that references the wrong cell. These mistakes don't announce themselves. They hide in your spreadsheets until an audit surfaces them, or worse, until they inform a strategic decision that sends your team down the wrong path. Benefits of Using Financial Analysis ToolsThe volume makes it worse. As transaction counts grow, so does your exposure. Small businesses might survive with basic ledgers, but scaling transforms data entry from tedious to impossible. You can't hire fast enough to keep pace. The work multiplies faster than headcount ever could.
When Geography Becomes a Barrier
Physical access to financial records sounds quaint until it becomes your bottleneck. Someone needs last quarter's analysis, but the files sit on a desktop three time zones away. A stakeholder requests updated projections during a client call, and you're left promising to "circle back" because the spreadsheet lives in someone else's inbox.
Remote work exposed this fragility. Teams that relied on shared drives and local files discovered their workflows couldn't flex. Collaboration meant emailing versions back and forth, each iteration creating new opportunities for confusion. Version 7_final_ACTUAL becomes the norm because tracking changes manually offers no better solution.
When a key team member leaves, the chaos intensifies. Their departure doesn't just create a staffing gap; it also creates a leadership gap. It reveals how much institutional knowledge lives exclusively in their heads, in their personal filing system, in their undocumented workarounds. The scramble to reconstruct their methods often costs more than the original analysis ever did.
The Audit Trail That Doesn't Exist
Paper-based systems and basic spreadsheets share a fatal flaw: they can't tell you what changed, when, or why. Someone updates a forecast, and the previous version disappears. A stakeholder questions a number from last month, and you're left searching through email archives, hoping someone saved the right file. This absence of version control makes disputes inevitable. Without a clear record of modifications, accountability becomes subjective. Teams waste hours reconstructing timelines that automated systems would capture by default. Compliance officers break into that cold sweat because they know what auditors will ask, and they know the answers don't exist in any organized form.
Analysis That Can't Keep Pace
The cruelest limitation isn't the time manual analysis consumes. It's the insights you never discover because extraction takes too long to justify the effort. You know patterns exist in your data. You suspect certain metrics correlate in meaningful ways. But testing those hypotheses requires hours of manipulation, formula writing, and validation that you simply don't have time for.
Strategic decisions are made on instinct rather than evidence because gathering evidence is too costly. You settle for surface-level reporting because depth feels impossible. The tools exist to answer sophisticated questions, but the manual work required to ask them creates a barrier you can't cross. Teams using fragmented workflows face this constantly. Switching between spreadsheets, note-taking apps, and analysis tools fragments your thinking. Each context switch costs momentum. The cognitive load of managing multiple systems leaves less capacity for the actual analytical work that matters.
Solutions like Otio consolidate this fragmented process into a single workspace designed for deep analytical work. Instead of juggling tools and losing context, you work with AI that understands your sources and helps extract insights without the usual friction. The platform handles organization and initial analysis, letting you focus on interpretation rather than data wrangling.
The Compliance Pressure Point
Regulatory requirements change faster than manual processes can adapt. New reporting standards emerge, and you're left retrofitting existing workflows that weren't built for the complexity. Each audit cycle brings anxiety because you're manually verifying what automated systems would validate continuously. The risk isn't just non-compliance. It's the opportunity cost of allocating your best analytical minds to checkbox exercises instead of strategic work. When talented professionals spend weeks preparing for audits rather than improving forecasting models, everyone loses. But understanding these limitations only matters if you know what becomes possible when you move past them.
15 Best Financial Analysis Tools

The right financial analysis platform depends on what you're actually trying to accomplish. If you need AI-powered research consolidation, you're solving a different problem than someone automating accounts payable. If you're running scenario models for enterprise planning, your requirements diverge completely from a small business tracking invoices. The tools below span this range, each built for specific workflows and organizational contexts.
1. Otio: AI-Native Workspace for Financial Research & Analysis
Otio consolidates financial research from scattered sources (articles, PDFs, reports, videos, web pages) into a single AI-powered workspace. Instead of juggling browser tabs, note-taking apps, and generic chatbots, you extract insights directly from your source documents. The platform generates AI notes from your materials, answers questions grounded in those specific sources, and helps draft research outputs without the usual context-switching friction.
Who should use it
Financial researchers and analysts, investment analysts and equity researchers, students working on finance or economics research, consultants and strategy teams, and content teams creating financial reports or market analysis.
What works
Centralizes scattered financial research into a single workspace. AI-generated notes reduce manual reading time. Source-grounded Q&A improves research accuracy. Supports unconventional data sources beyond academic papers. What doesn't: Not a traditional accounting or modeling tool. Requires structured research habits to get full value. Advanced features may have a learning curve.
2. Microsoft Dynamics: Centralized ERP & CRM Integration
Microsoft Dynamics integrates ERP and CRM functions to centralize financial, sales, and operational data, as well as customer data. It enables real-time financial reporting, AI-driven insights, automated workflows, and cross-department collaboration.
Who should use it
Mid-sized to large enterprises, finance and operations teams, businesses needing CRM plus finance integration, and organizations already using Microsoft products.
What works
Deep integration across business functions. Scalable and modular architecture. Strong analytics and AI-powered insights. Seamless integration with the Microsoft ecosystem.
What doesn't
Implementation can be complex and costly. Overkill for small businesses. Customization often requires expert support.
3. Zest AI: AI-Powered Lending & Risk Assessment
Zest AI uses machine learning to improve credit risk assessment, underwriting decisions, and loan approval processes. It helps lenders reduce bias, increase approval rates, and manage risk more accurately.
Who should use it
Banks and credit unions, fintech lenders, risk management teams, and financial institutions focused on inclusive lending.
What works
Improves loan approval accuracy. Reduces bias in credit decisions. Enhances risk prediction models. Supports regulatory compliance.
What doesn't
Highly specialized for lending use cases. Requires quality historical data. Not suitable for general financial management.
4. Tipalti: Accounts Payable & Global Payments Automation
Tipalti automates accounts payable, supplier onboarding, tax compliance, and global payment processing. It supports multi-currency payments and international vendors with built-in compliance workflows.
Who should use it
Scaling businesses with global suppliers, finance and AP teams, SaaS and digital-first companies, and enterprises managing complex payment structures.
What works
Strong global payment and tax compliance support. Automates invoice approvals and workflows. Reduces manual errors and payment delays. Integrates with major accounting systems.
What doesn't
Pricing may be high for small businesses. Setup can be time-consuming. More AP-focused than full financial analysis.
5. Anaplan: Connected Planning & Scenario Modeling
Anaplan is a connected planning platform that enables budgeting, forecasting, scenario modeling, and performance planning across finance, sales, and operations.
Who should use it
FP&A teams, large organizations with complex planning needs, strategy and finance leadership, and enterprises needing real-time scenario analysis.
What works
Powerful scenario and what-if modeling. Encourages cross-functional collaboration. Supports zero-based budgeting. Real-time data updates.
What doesn't
Steep learning curve. High implementation and licensing costs. Requires dedicated planning resources.
6. Stampli: AI-Driven Accounts Payable Automation
Stampli focuses on automating invoice processing using AI. It captures invoice data, performs PO matching, and provides real-time AP analytics while integrating with existing ERPs.
Who should use it
Finance and AP teams, mid-sized to large businesses, and companies seeking invoice automation without ERP replacement.
What works
Strong AI invoice capture and coding. Easy collaboration on invoice approvals. ERP-friendly integration approach. Reduces manual AP workload.
What doesn't
Limited beyond AP automation. Not a full accounting solution. Reporting depth may vary by ERP integration.
7. AlphaSense: AI-Driven Financial & Market Research

AlphaSense uses AI to analyze earnings calls, SEC filings, research reports, and market news to uncover trends, risks, and investment opportunities. It also offers sentiment analysis.
Who should use it
Investment analysts and portfolio managers, hedge funds and asset managers, corporate strategy teams, and equity research professionals.
What works
Rapid access to high-quality financial intelligence. Strong document search and sentiment analysis. Saves hours of manual research. Excellent for competitive and market analysis.
What doesn't
Expensive compared to basic research tools. Not designed for accounting or bookkeeping. Requires finance knowledge to interpret insights.
8. Oracle Essbase: OLAP & Financial Analytics Database
Oracle Essbase is a multidimensional database designed for advanced financial modeling, budgeting, forecasting, and business intelligence applications.
Who should use it
Large enterprises, financial planning and BI teams, organizations with complex data structures, and companies using Oracle ecosystems.
What works
Powerful multidimensional analysis. Handles complex financial models. Strong performance for large datasets. Enterprise-grade reliability.
What doesn't
Technical setup and maintenance. Less user-friendly for non-technical users. High cost and licensing complexity.
9. Xero: User-Friendly Accounting Software
Xero simplifies accounting tasks such as invoicing, expense tracking, bank reconciliation, and financial reporting with a clean, intuitive interface.
Who should use it
Small businesses and startups, freelancers and solopreneurs, accountants managing multiple clients.
What works
Easy to use and cloud-based. Automated bank feeds. Strong integration ecosystem. Affordable for SMBs.
What doesn't
Limited advanced financial modeling. Payroll features vary by region. Less customization for complex enterprises.
10. QuickBooks: Comprehensive Accounting for SMBs
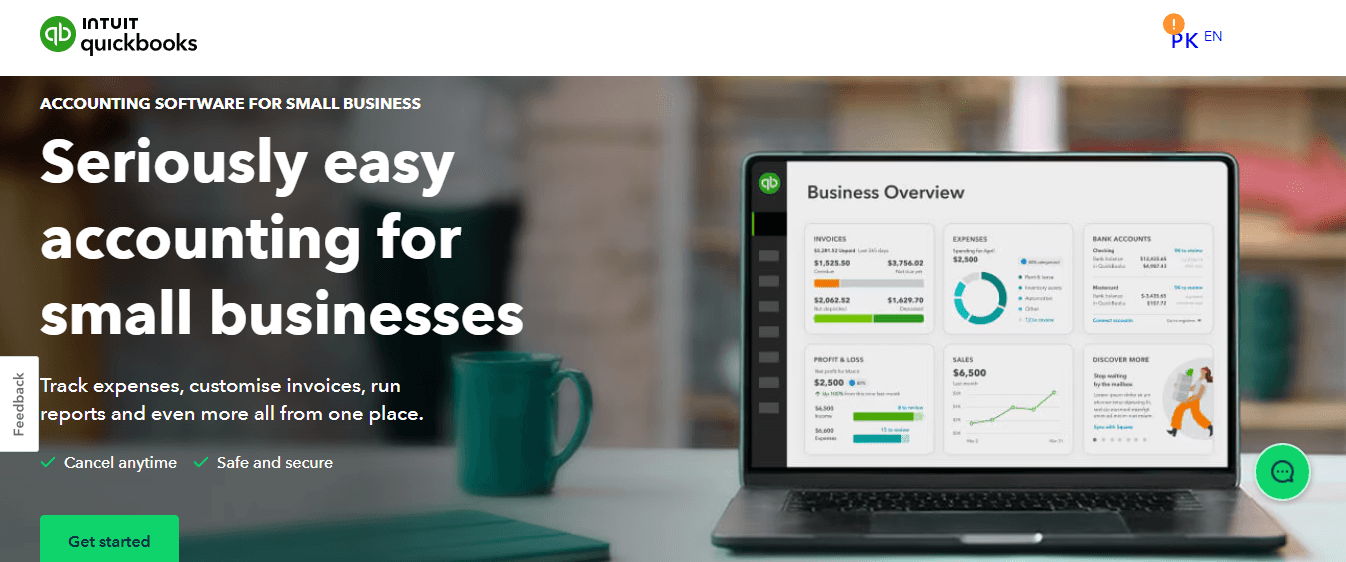
QuickBooks provides end-to-end accounting features, including invoicing, payroll, inventory tracking, tax preparation, and financial reporting.
Who should use it
Small to mid-sized businesses, retailers and service providers, and entrepreneurs need all-in-one accounting.
What works
Widely adopted and trusted. Strong reporting and tax features. Scalable plans. Large ecosystem of accountants and integrations.
What doesn't
Can become expensive with add-ons. Performance issues with very large datasets. The interface can feel cluttered over time.
11. Bill.com: AP & AR Automation Platform
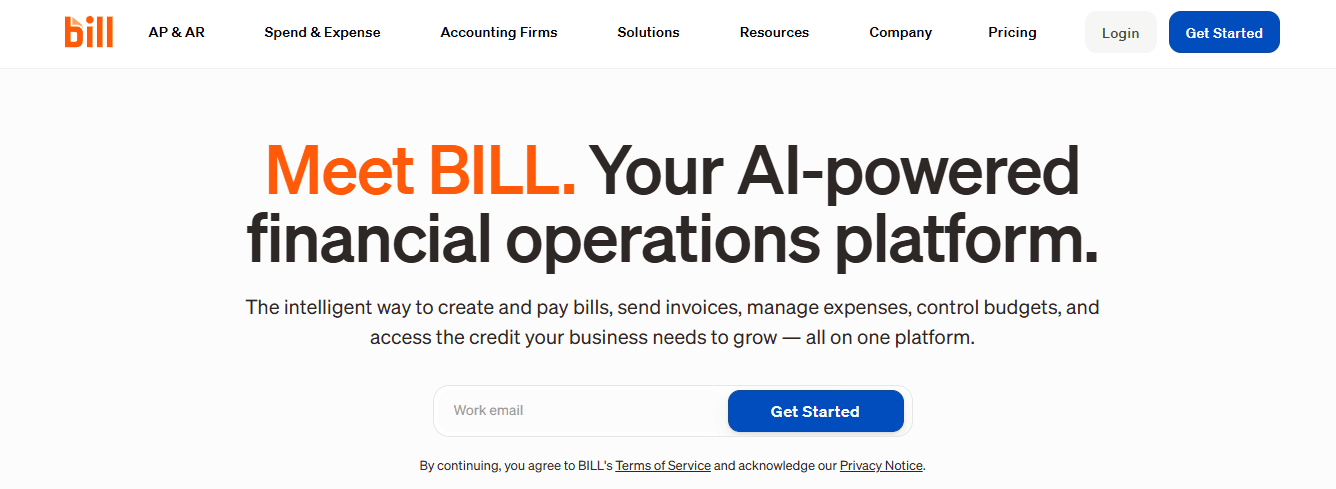
Bill.com automates accounts payable and receivable workflows, enabling electronic payments, automated approvals, and seamless integration with accounting software.
Who should use it
SMB finance teams, companies managing recurring payments, and businesses seeking paperless payments.
What works
Speeds up payment cycles. Reduces manual invoice handling. Strong accounting software integrations. Improves cash flow visibility.
What doesn't
Transaction fees can add up. Limited analytics compared to ERP systems. Customization is moderate.
12. NetSuite: Cloud-Based ERP & Financial Analytics
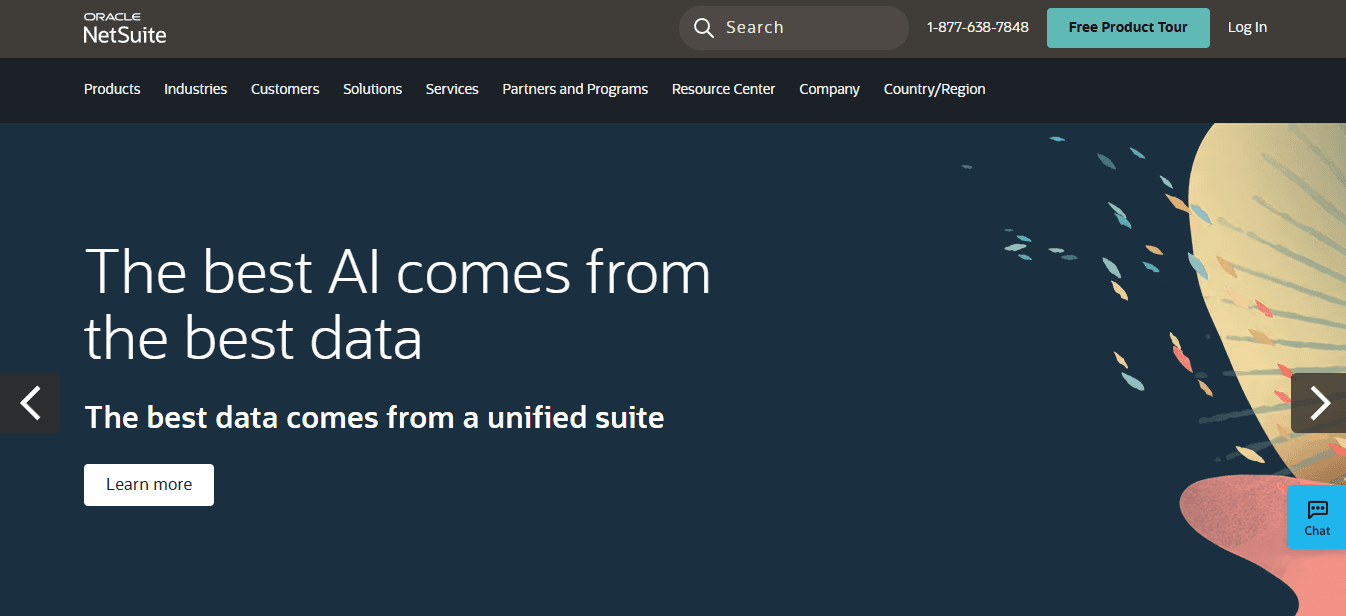
NetSuite provides a full ERP suite covering financial management, CRM, inventory, and real-time analytics in a single cloud platform. According to Visbanking, the platform serves over 10,000 banks and financial institutions globally and processes more than 5 billion data records annually.
Who should use it
Growing mid-sized companies, enterprises needing full ERP, and global businesses with complex operations.
What works
Unified financial and operational data. Real-time business insights. Scalable as the company grows. Strong compliance and reporting.
What doesn't
Expensive implementation. Customization requires expertise. Overkill for small teams.
13. Kissflow: Finance Workflow Automation
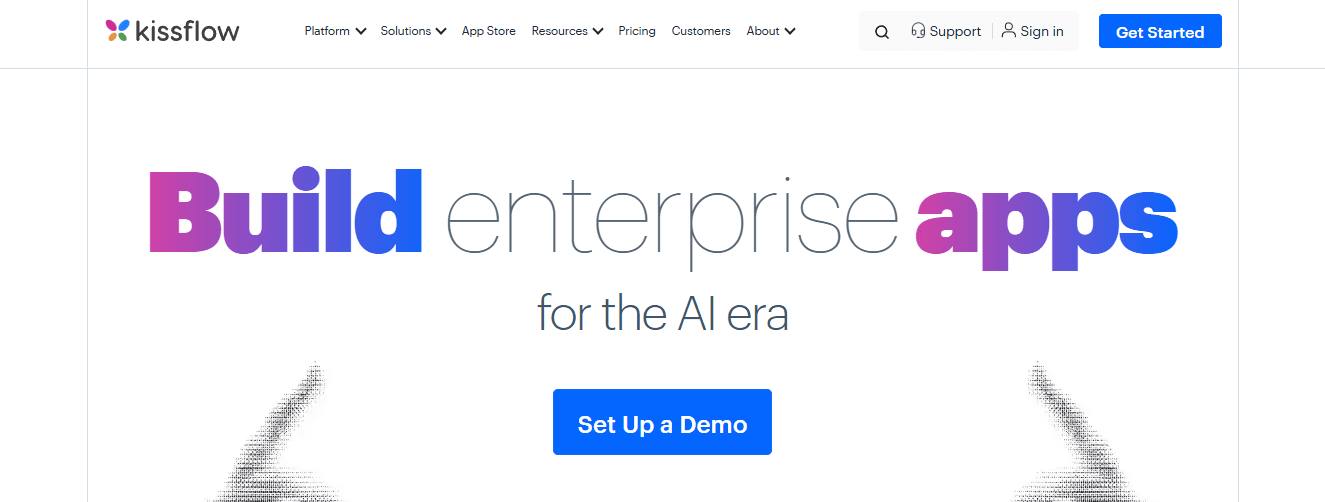
Kissflow enables the automation of finance workflows, such as purchase orders, expense approvals, and invoice processing, with customizable no-code workflows.
Who should use it
Finance operations teams, organizations with approval-heavy processes, and businesses seeking no-code automation.
What works
Easy workflow customization. Improves process transparency. Integrates with financial systems. Minimal coding required.
What doesn't
Not a core accounting system. Advanced analytics are limited. Best used alongside other finance tools.
14. Sage Intacct: Advanced Financial Management for SMBs
Sage Intacct delivers cloud-based financial management with strong reporting, budgeting, cash flow forecasting, and multi-entity accounting.
Who should use it
Small to mid-sized businesses, finance-led organizations, and companies outgrowing basic accounting tools.
What works
Strong financial reporting and dashboards. Scalable and cloud-native. Excellent for multi-entity accounting. Trusted by finance professionals.
What doesn't
Higher cost than entry-level tools. Limited non-finance features. Implementation requires planning.
15. Dynamics 365 Finance: Enterprise Financial Operations Automation
Dynamics 365 Finance automates global financial operations, including general ledger, AP/AR, budgeting, forecasting, and compliance reporting.
Who should use it
Large enterprises, global finance teams, and companies with complex regulatory needs.
What works
Robust financial automation. Strong global compliance support. Advanced analytics and forecasting. Integrates with the Microsoft ecosystem.
What doesn't
Complex deployment. High licensing and implementation costs. Requires trained finance and IT teams.
When Implementation Costs More Than Expected
Most organizations underestimate how much time proper tool adoption actually requires. The sales demo shows clean data flowing seamlessly through dashboards. Reality involves months of configuration, data migration headaches, and training sessions that reveal how differently each department interprets the same financial concepts.
Teams using fragmented workflows between spreadsheets, note-taking apps, and generic chatbots lose context with every tool switch. Platforms like Otio consolidate financial research and analysis into a single workspace built specifically for deep analytical work. The system works exclusively with your source documents rather than generating generic responses, maintaining the grounded, evidence-based approach that financial analysis demands. Instead of juggling multiple tools and reconstructing context, you extract insights directly from your financial documents while the AI handles organization and initial analysis.
The challenge intensifies when you're working with legacy data. According to Visbanking, many financial institutions struggle to consolidate over 30 years of disparate data sources when implementing new analysis platforms. That historical information lives in outdated formats, deprecated systems, and sometimes physical archives that resist digital conversion. The new tool can't deliver insights from data it can't access.
Matching Tool Capability to Actual Workflow
The most powerful platform delivers zero value if it doesn't align with how your team actually works. Enterprise ERPs offer incredible depth, but small finance teams drown in features they'll never use. Simple accounting software handles basic bookkeeping beautifully until growth demands scenario modeling that it can't provide.
Watch for the gap between advertised capabilities and practical application. A platform might technically support multi-currency transactions, but if the workflow requires three different screens and manual reconciliation steps, you haven't actually solved the problem. You've just moved it inside a more expensive system.
Integration promises often exceed reality. Two platforms might claim seamless data exchange, but "seamless" sometimes means you'll spend Tuesday afternoons troubleshooting API errors and reconciling discrepancies between systems that interpret the same transaction differently. The technical connection exists. The practical value requires ongoing maintenance that nobody budgeted for. But choosing the right platform matters only if you know how to evaluate what "right" actually means in your specific context.
Related Reading
• Best AI Tools for Finance
• How to Improve Forecast Accuracy
• How to Write an Analysis Report
• Automated Reporting Tools
• Finance Automation Tools
• Finance Workflow
• Budget Variance Analysis
• AI to Analyze Calls
• Robotic Accounting Automation
• Private Equity Analysis Tools
Benefits of Using Financial Analysis Tools

When you automate financial analysis, you reclaim time previously spent on spreadsheet maintenance. You reduce the error rate caused by manual data entry. You create space for the strategic thinking that actually moves your organization forward. The transformation isn't subtle. It changes how your finance team spends their days and how confidently your leadership makes decisions.
Precision That Compounds Over Time
Calculation errors don't stay contained. A single mistake in Q1 reporting cascades through quarterly comparisons, annual forecasts, and budget allocations. Automated tools eliminate transposition errors, formula errors, and reference errors that plague manual spreadsheets. The system validates data as it enters, flags anomalies before they propagate, and maintains consistency across every report you generate.
Research from Accord Consulting documents a 45% increase in financial accuracy when organizations transition from manual to automated analysis. That improvement isn't just about catching mistakes. It's about building a foundation of trust in your numbers. When stakeholders know the data reflects reality, they stop second-guessing and start acting.
The reliability extends beyond simple arithmetic. Modern financial analysis platforms validate data against multiple sources, automatically cross-reference transactions, and maintain audit trails that show exactly how each figure was derived. You move from hoping your numbers are right to knowing they are.
Speed That Changes Decision Timelines
Manual analysis operates on a different clock than business decisions. By the time you finish consolidating last month's data, the insights will have passed their useful life. Market conditions shift. Competitors move. Opportunities close. Your analysis arrives too late to inform the choice that mattered.
According to Accord Consulting, organizations experience a 67% reduction in time spent on manual reporting after implementing automated tools. That compression doesn't just save hours. It fundamentally changes what becomes possible. You can run scenario analyses during the meeting instead of promising results next week. You can test assumptions in real time rather than committing to a direction based on incomplete information.
Speed creates optionality. When generating a forecast takes minutes instead of days, you can explore more alternatives. You can stress-test assumptions. You can answer follow-up questions to determine whether an opportunity is real or just appealing on the surface.
Analytical Depth Without Additional Headcount
Basic ratio calculations and trend analysis represent the floor of financial insight, not the ceiling. The meaningful discoveries live in variance analysis, regression modeling, sensitivity testing, and multi-variable forecasting. Manual processes rarely reach that depth because the effort required exceeds what most teams can justify.
Automated platforms handle the computational heavy lifting. They process thousands of data points in seconds, identify correlations humans would miss, and surface patterns that warrant investigation. The analyst's role shifts from data gatherer to insight interpreter. Instead of spending Tuesday afternoon building pivot tables, you spend it understanding why gross margins compressed in the Northeast region but not the Southeast.
This capability gap becomes critical as business complexity grows. Multiple product lines, diverse revenue streams, international operations, and varied customer segments all create analytical demands that manual methods simply cannot meet. The volume overwhelms human processing capacity long before the insights run out.
Collaboration That Breaks Down Information Silos
Finance doesn't operate in isolation. Sales need revenue projections. Operations wants cost forecasts. Leadership requires scenario planning. When financial data lives in disconnected spreadsheets and local files, every request becomes a negotiation about versions, timing, and access.
Centralized financial platforms give stakeholders direct access to the data they need without creating security risks or version control chaos. Marketing can pull campaign ROI metrics without waiting for the finance team to generate a custom report. Department heads can track their budget utilization in real time rather than discovering overages after the fact. Everyone works from the same numbers because everyone accesses the same system.
This transparency changes how cross-functional teams operate. Disputes about data accuracy disappear when everyone sees the same source. Strategic planning becomes collaborative rather than sequential because participants can test assumptions together. The friction that used to slow decision-making simply vanishes.
Teams using fragmented workflows between spreadsheets, note-taking apps, and generic chatbots lose context with every tool switch. Otio consolidates financial research and analysis into a single workspace built for deep analytical work. The platform works exclusively with your source documents rather than generating generic responses, maintaining the grounded, evidence-based approach that financial analysis demands. Instead of juggling multiple tools and reconstructing context, you extract insights directly from your financial documents while the AI handles organization and initial analysis.
Reporting That Adapts to Your Audience
Your CFO needs different information from your board. Your department heads care about different metrics than your investors. Generic reports force audiences to extract relevant insights from data that wasn't designed for their questions. Custom reporting lets you match the message to the recipient. Automated tools generate audience-specific outputs without multiplying your workload. The same underlying data feeds executive summaries, detailed variance reports, investor presentations, and operational dashboards. You define the format once, then generate it repeatedly as new data arrives. No more rebuilding presentations from scratch each quarter. No more maintaining separate spreadsheets for different stakeholder groups.
This flexibility extends to timing as well. Some audiences need monthly updates. Others require weekly snapshots or real-time access. Automated systems accommodate all these cadences simultaneously without creating parallel workflows or duplicate effort. But understanding what modern tools can do only matters if you know which specific platforms deliver on these promises.
Supercharge Your Researching Ability With Otio — Try Otio for Free Today
In today’s fast-paced digital world, knowledge workers, researchers, and students are inundated with information from various sources. This content overload can be overwhelming, especially when trying to make sense of it all using fragmented, complex, and manual tools. Many people resort to using a combination of bookmarking, read-it-later, and note-taking applications to manage their research workflows. However, this approach is inefficient and often leads to more confusion. Otio offers a solution to this problem by providing a single AI-native workspace that streamlines the research process. This tool enables users to collect, extract key takeaways, and create content from a diverse array of data sources with ease.
Related Reading
• Alphasense Alternatives
• Financial Modeling Tools
• AI Budgeting Tools
• Crunchbase vs Pitchbook
• Pitchbook Competitors
• Cb Insights vs Pitchbook
• Grata vs Sourcescrub
• Ibm Watson vs Chatgpt
• Microsoft Dynamics 365 Alternatives


