
Data Analysis
18 Best AI Tools for CSV Analysis and Data-Heavy Workflows
Compare 18 AI tools for CSV analysis, spreadsheets, charts, statistics, automation, and research workflows. Find the best fit by file size, formulas, privacy, and export needs.

The best AI tool depends on what you need to do with the CSV
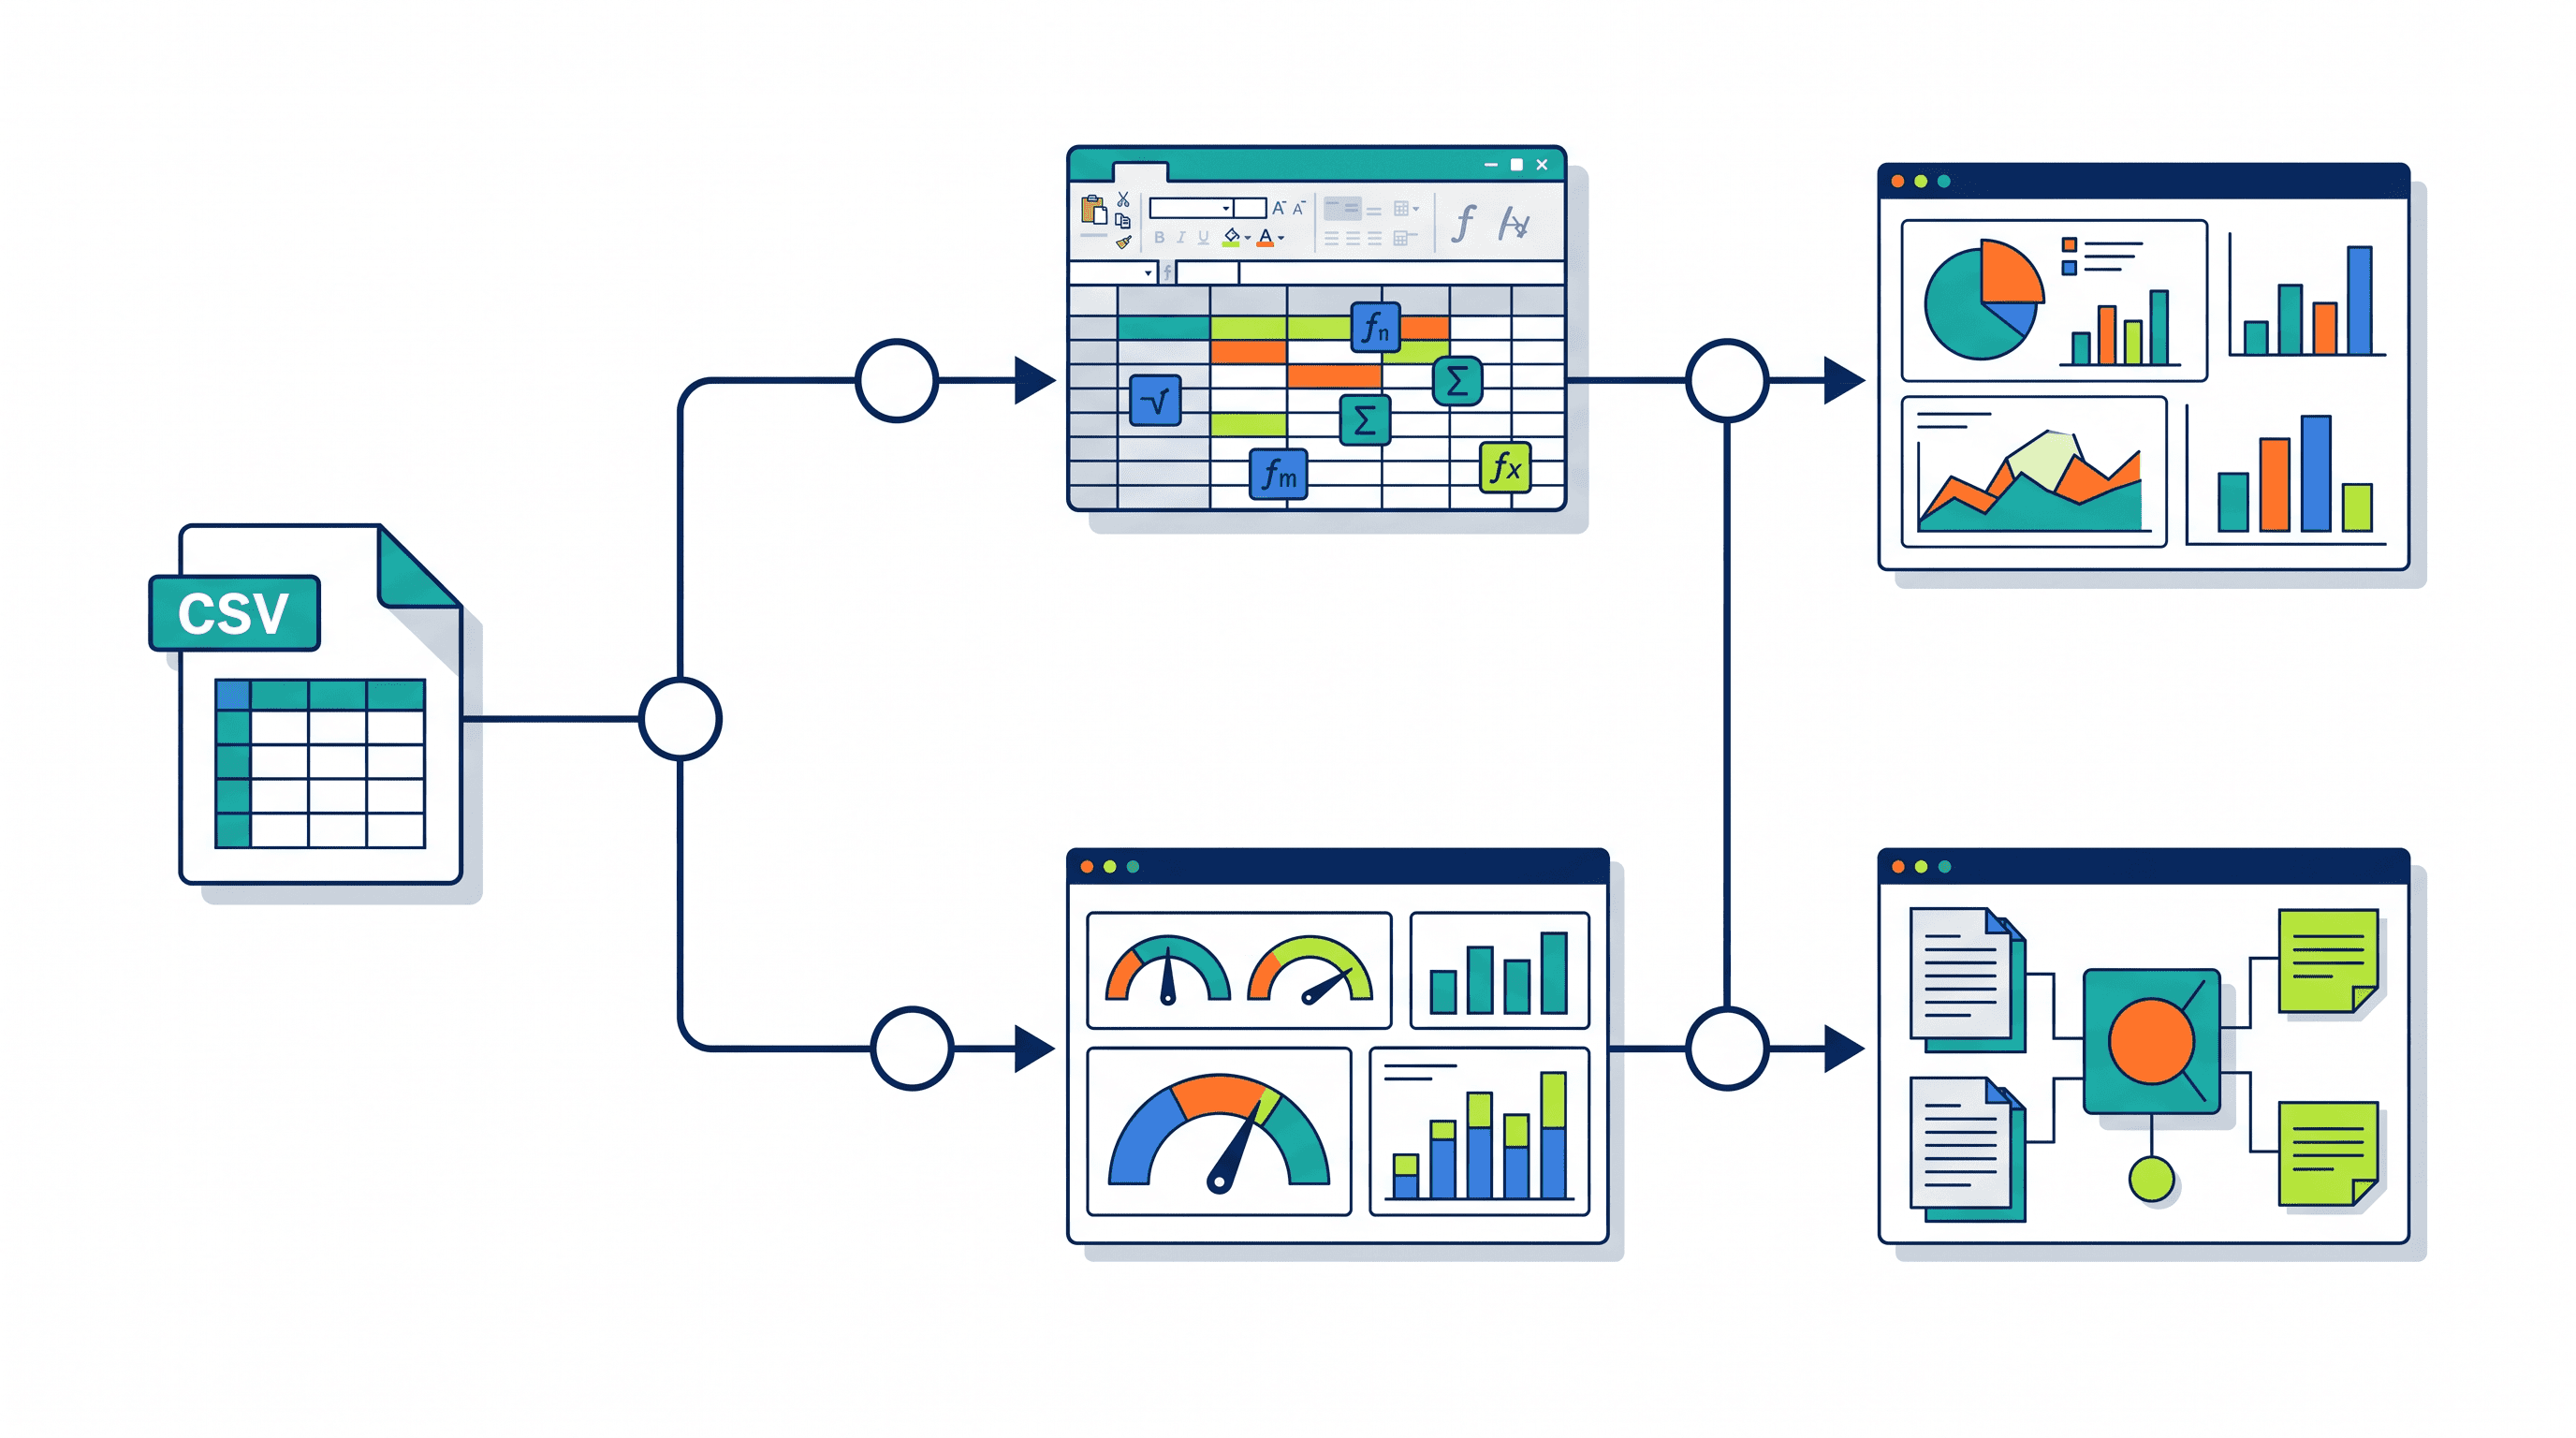
If the CSV needs formulas, pivots, and workbook logic, start with Excel Copilot or Google Sheets with Gemini. If the job is exploratory analysis, use ChatGPT, Claude, Julius AI, Quadratic, or another analysis-first tool; if the CSV feeds a recurring business dashboard, use Power BI or Tableau; if the CSV sits next to PDFs, web sources, and notes, use a research workspace such as Otio.
The wrong choice usually fails in one of three places: file size, reproducibility, or workflow fit. A chat assistant may answer quickly but hide assumptions. A BI platform may govern the metric properly but take too much setup for a one-off file. A spreadsheet may preserve formulas but struggle with messy multi-file analysis.
AI can speed up CSV analysis, but it does not remove the need to check the math. For financial, medical, academic, legal, or operational decisions, validate totals, filters, excluded rows, and formulas against the original file before using the result.
Here is the quick chooser:
Need | Start with | Why |
|---|---|---|
Formula-heavy spreadsheet work | Excel Copilot, Google Sheets Gemini, Rows | Keeps the work close to cells, formulas, charts, and exports |
Natural-language exploration | ChatGPT, Claude, Gemini, Julius AI, ChatCSV | Good for asking “what changed?” and “what are the outliers?” |
Predictive modeling | Akkio, Obviously AI | Better fit for classification, forecasting, and model evaluation |
Governed dashboards | Power BI, Tableau | Built for recurring metrics, permissions, refreshes, and reporting |
Public charts | Datawrapper | Best when the output is a clean chart, not a full analysis environment |
CSV plus documents and sources | Otio, Hex | Useful when data has to be interpreted alongside evidence, notes, or code |
Before uploading any data-heavy file, compare tools on:
File handling: accepted formats, maximum size, row and column limits, encoding support, and whether large files are sampled.
Cleaning: missing values, duplicate rows, inconsistent dates, currency symbols, mixed data types, and non-UTF-8 characters.
Analysis transparency: whether the tool shows formulas, code, filters, source columns, and assumptions.
Outputs: CSV, XLSX, PDF, chart images, notebooks, dashboards, or shareable reports.
Privacy: retention settings, training-use policies, workspace permissions, regional controls, and deletion options.
Collaboration: comments, shared workspaces, access roles, version history, and review workflows.
Best general-purpose AI assistants for asking questions about CSVs
1. ChatGPT: best flexible starting point for one-off CSV questions
ChatGPT is the most familiar entry point for conversational CSV analysis. It works well when the task is broad: inspect a file, explain columns, clean obvious issues, generate Python or spreadsheet formulas, summarize trends, and create quick charts.
Its strength is flexibility. A single conversation can move from “what columns are in this file?” to “group revenue by month” to “write the pandas code so I can reproduce this.” That makes it useful for analysts who want both an answer and a method.
The limitation is governance. Depending on the plan, model, workspace settings, and current product behavior, upload limits and analysis features can vary. For repeatable work, ask ChatGPT to show the code, aggregation level, filters, and any rows it excluded.
Use it when:
You need a fast first pass on a CSV.
You want code, formulas, or chart ideas.
The file is not too sensitive for the account and workspace settings in use.
You can validate the output elsewhere.
Avoid relying on it alone when the result affects accounting, clinical decisions, academic claims, or production operations.
2. Claude: best for explaining messy tables and long analytical context
Claude is strong when the CSV analysis sits inside a longer explanation. It is often useful for messy tables, ambiguous columns, and questions where the answer needs careful wording rather than only a number.
The practical appeal is its context handling. You can ask it to reason through what a dataset appears to contain, flag likely data-quality problems, and explain why a calculation may be misleading. That helps when the CSV is unfamiliar or inherited from another team.
The tradeoff is that not every CSV task is just a reading task. Chart generation, code execution, upload limits, and file handling depend on the current product version and plan. For large datasets, ask whether it processed the full file or inferred from a sample.
Use Claude when:
The dataset needs interpretation, not just calculation.
You want a careful explanation of assumptions.
You are combining a CSV with longer instructions or background documents.
You can rerun calculations in a spreadsheet or notebook.
If you are comparing Claude specifically for upload-heavy work, read more on Claude file upload limits.
3. Google Gemini: best for Google Drive and Google Sheets users
Gemini is a natural fit if the CSV already lives in Google Drive or ends up in Google Sheets. It is useful for users who want conversational help without leaving the Google workspace.
There are two different workflows to separate. One is conversational CSV analysis: upload or reference a file, ask questions, and get a generated answer. The other is spreadsheet-connected work: use AI assistance inside or alongside Sheets to generate formulas, summaries, categories, and charts.
The second workflow is usually safer for recurring spreadsheet work because the data remains visible in the sheet. You can inspect ranges, check formulas, share the file with collaborators, and preserve the source table.
Use Gemini when:
Your team already works in Google Workspace.
Collaboration and sharing matter.
You want AI help near the spreadsheet.
The analysis does not require a full BI model or statistical notebook.
Check workspace eligibility, admin controls, sharing permissions, and export behavior before using it on confidential data.
4. Microsoft Copilot: best for Microsoft 365 business workflows
Microsoft Copilot is strongest when the CSV belongs inside a Microsoft 365 workflow: Excel, Teams, SharePoint, OneDrive, PowerPoint, and business reporting.
For CSV analysis, the most important use case is Excel. Copilot can help explain tables, suggest formulas, summarize columns, propose charts, and assist with workbook-based analysis. It is also useful when the final output needs to become a slide, memo, or business update.
The key question is plan availability. Copilot features vary by Microsoft 365 license, admin configuration, data location, and app. Before evaluating the analysis quality, confirm that your organization’s plan supports the exact workflow you need.
Use Microsoft Copilot when:
Your CSVs live in Excel, OneDrive, or SharePoint.
Permissions and enterprise identity matter.
The output needs to stay inside Microsoft 365.
Reviewers need to inspect workbook formulas and source ranges.
Best spreadsheet-native AI tools for formulas and recurring analysis
5. Microsoft Excel with Copilot: best for formula-heavy workbooks
Excel remains the default for many CSV workflows because it keeps the data, formulas, pivots, charts, and exports in one place. Copilot adds natural-language help to that environment.
It is a good fit for questions like:
“Create a formula to calculate gross margin by row.”
“Summarize sales by region and quarter.”
“Suggest a chart for monthly churn.”
“Explain what this pivot table shows.”
“Flag unusual values in this column.”
The main advantage is inspectability. A reviewer can click the formula, inspect the range, check the pivot table, and compare the result to the original CSV. That is harder in a chat-only workflow.
The main risk is misplaced confidence. A formula can reference the wrong range, treat text as numbers, ignore hidden rows, or calculate percentages with the wrong denominator. Always inspect formulas and source ranges before relying on the answer.
6. Google Sheets with Gemini: best for collaborative spreadsheet analysis
Google Sheets with Gemini is useful when several people need to review, clean, and discuss the same CSV. The collaboration model is the main benefit: comments, sharing, version history, and visible cell-level work.
It fits lightweight recurring analysis: categorizing records, generating formulas, summarizing columns, creating charts, and drafting short explanations of the data. It is also convenient for teams that collect CSV exports from forms, analytics tools, CRMs, or research spreadsheets.
The tradeoff is scale and complexity. Very large files, complex modeling, and strict governance requirements may push the work toward BigQuery, Looker, Power BI, Tableau, or a notebook environment.
Use it when the spreadsheet is the record of work. If the AI gives an answer, preserve the formula, filter, or chart in the sheet so someone else can reproduce it.
7. Airtable AI: best for turning CSVs into structured workflows
Airtable AI is not mainly a statistics tool. Its value appears when a CSV needs to become a structured operational database: records, fields, views, classifications, owners, due dates, statuses, and lightweight automations.
For example, a CSV of user feedback can become a table with fields for product area, sentiment, urgency, customer segment, and follow-up owner. A CSV of grants, vendors, leads, or research sources can become a collaborative tracker.
That is different from asking for a regression model or a statistical test. Airtable is strongest when the row becomes an object in a workflow.
Use Airtable AI when:
The CSV represents work items, records, leads, feedback, or tasks.
You need categorization and routing.
Non-technical collaborators need to update records.
Views and automations matter more than advanced statistics.
Use a dedicated analysis tool if the question is primarily mathematical.
8. Rows: best spreadsheet-style analysis with integrations
Rows sits between a spreadsheet and a lightweight reporting tool. It is useful for users who want spreadsheet editing, imported data, formulas, connectors, and AI-assisted analysis without moving straight to a BI platform.
It is a good candidate for business teams that regularly import CSVs from tools and turn them into quick reports. The spreadsheet metaphor keeps the work approachable, while integrations can reduce manual copy-paste.
Before adopting it for CSV-heavy workflows, check connector availability, pricing limits, export formats, and how it behaves with larger datasets. Also test whether formulas, charts, and data transformations can be reviewed and reused by someone who did not create the original analysis.
Best dedicated AI data-analysis tools for exploratory work
9. Julius AI: best for natural-language exploratory data analysis
Julius AI is built around asking analytical questions about data files. It is a better fit than a general chatbot when the core task is exploratory data analysis: charts, summaries, correlations, outliers, and statistical questions.
The appeal is that it speaks the language of data analysis without requiring every user to write Python. You can ask a question, refine it, request a visualization, and continue exploring.
The evaluation point is transparency. A good answer should expose how it got there: columns used, filters applied, grouping level, statistical method, and any transformations. If it cannot show enough method to reproduce the result, treat the output as a draft.
Use Julius AI when:
You want conversational analysis focused on tabular data.
You need charts and descriptive statistics quickly.
You are comfortable checking the underlying calculation.
The dataset fits within the current plan’s file limits.
10. ChatCSV: best simple conversational CSV analysis
ChatCSV is a focused option for asking questions about CSV files. Its simplicity is the point: upload a CSV, ask questions, get answers.
That makes it useful for beginners, students, and non-technical users who do not want to set up a notebook or BI dashboard. It can help with column explanations, quick summaries, simple comparisons, and basic trend questions.
The same simplicity can become a limitation. Advanced modeling, governance, reproducibility, multi-step transformations, and enterprise permissions may be weaker than in a spreadsheet, notebook, or BI platform.
Use ChatCSV when:
The dataset is small enough for a simple workflow.
The questions are descriptive.
The output is a first-pass answer.
You can verify totals and charts elsewhere.
11. Quadratic: best notebook-style spreadsheet for technical analysts
Quadratic is useful for people who want a spreadsheet interface but also need code. It combines cells, data, formulas, code-style analysis, and AI assistance in a more technical environment than a traditional spreadsheet.
That makes it attractive for analysts who sit between business spreadsheets and Python notebooks. You can work in a grid, but you are not limited to spreadsheet formulas when the analysis becomes more complex.
The learning curve is the tradeoff. It may be too much setup for a single CSV question. It becomes more compelling when analysis needs to be repeated, extended, or shared with technical collaborators.
Use Quadratic when:
Spreadsheet users need access to code-like flexibility.
The analysis may grow beyond formulas.
You want an interactive working surface, not just chat.
Reproducibility matters more than a quick answer.
12. Akkio: best for no-code predictive analysis
Akkio is best considered when the question is predictive, not descriptive. Instead of only asking “what happened?”, you are asking “what is likely to happen?” or “which rows are most likely to belong to this class?”
That makes it relevant for lead scoring, churn prediction, forecasting, classification, and similar tabular machine-learning workflows. It is not the first tool to open if all you need is a sum, pivot, or bar chart.
For predictive work, demand model evaluation. Ask how the data was split, which target column was used, what features were included, what metric was optimized, and how the model performed on holdout data. Also check whether leakage is possible: for example, a column that reveals the outcome after the fact.
Use Akkio when:
You have a clear target variable.
Prediction or classification is the goal.
Non-technical users need a no-code interface.
You can review model performance and assumptions.
13. Obviously AI: best for no-code tabular prediction
Obviously AI is another no-code predictive modeling tool for structured data. Like Akkio, it is most useful when a CSV contains rows that can train a model: customers, transactions, leads, cases, products, or events.
The main distinction from simple CSV chat is intent. If you ask, “What was revenue last quarter?”, use a spreadsheet or data-analysis assistant. If you ask, “Which accounts are likely to churn?”, a predictive tool may be more appropriate.
The tool fit depends on data quality. Predictive modeling needs clean labels, enough relevant rows, stable feature definitions, and a plan for validation. If the source CSV is inconsistent or the target column is poorly defined, the interface cannot fix the underlying problem.
Use Obviously AI when:
You need a prediction, not only a report.
The target variable is well-defined.
Stakeholders need no-code modeling.
You can explain and validate the model before acting on it.
Best AI tools for dashboards, charts, and business reporting
14. Microsoft Power BI with Copilot: best for governed business dashboards
Power BI is the right category when a CSV is not the final object. The final object is a governed report: recurring metrics, refresh logic, permissions, semantic models, and dashboards that multiple teams trust.
Copilot can help with report creation, measure explanation, summaries, and visual exploration, depending on the current Microsoft setup. But Power BI is still a business intelligence platform, not a casual CSV chatbot.
The complexity is worth it when the metric will be reused. A sales dashboard, finance report, operational KPI tracker, or executive scorecard benefits from controlled definitions and permissions. A one-off classroom CSV usually does not.
Use Power BI when:
The CSV feeds recurring reporting.
Access control matters.
Metrics need shared definitions.
Data refresh and dashboard distribution are part of the workflow.
For broader reporting comparisons, see Otio’s guide to data reporting tools.
15. Tableau with Tableau Pulse or AI features: best for interactive visual analytics
Tableau is strongest when the job is visual exploration and recurring dashboard use. It is designed for interactive charts, business metrics, data modeling, and shared reporting.
AI features can help users ask questions, surface metric changes, and interpret dashboards. The important point is that Tableau works best when the data model is worth building. It is not the fastest path for a single quick calculation.
Use Tableau when:
Visual exploration is central.
Stakeholders need interactive dashboards.
Metrics will be monitored over time.
Your organization already has Tableau governance and publishing workflows.
If your main need is one CSV and five questions, start simpler. If the analysis becomes a recurring management artifact, Tableau becomes easier to justify.
16. Datawrapper: best for publishing clear charts from tabular data
Datawrapper is a chart and map publishing tool. It is the right choice when the deliverable is a clear, embeddable visualization, especially for journalism, communications, public reports, and web publishing.
It is not a full statistical-analysis environment. You should clean the CSV, verify the numbers, and decide the chart logic before treating Datawrapper as the presentation layer.
Use Datawrapper when:
The output is a public chart or map.
Clarity matters more than advanced modeling.
You need embeddable visuals.
The analysis has already been checked.
For a broader scan of charting products, see AI visualization tools for data.
Best AI research workspace for CSVs plus documents and sources
17. Otio: best when the CSV is part of a larger research file
Otio’s AI data analysis workspace is a strong fit when a CSV is only one piece of the project. That is common in research-heavy work: the table sits next to PDFs, web pages, notes, transcripts, reports, and source documents.
Otio supports CSV files in its unified Library, with a dedicated CSV viewer. You can keep the file in a project Space alongside PDFs, DOCX files, web links, YouTube videos, notes, and other materials. Then you can use AI chat to ask about the CSV while still keeping the broader evidence base nearby.
The differentiator is context. A market researcher might compare a survey CSV against interview transcripts and competitor pages. A student might analyze a dataset while citing academic papers. A consultant might inspect operational data while reading client documents and notes.
Otio also supports generated charts and visualizations in chat, plus per-chat model selection across GPT, Claude, Gemini, Grok, Llama, DeepSeek, Moonshot, and Otio Auto. That matters because the best model for explanation is not always the best model for data cleaning or chart reasoning. If you want model choice inside one workspace, Otio’s multiple AI models feature is the relevant capability.
A practical workflow looks like this:
Upload the CSV into a project Space and preserve the original file unchanged.
Add relevant sources such as PDFs, web pages, prior reports, interview notes, or methodology documents.
Ask for a data dictionary: column names, likely data types, ambiguous fields, missing values, duplicates, and suspicious formats.
Ask for a quality check: inconsistent dates, currency symbols, mixed text and numbers, outliers, and rows that may need review.
Request a chart or analysis with explicit instructions: grouping, date range, denominator, units, and excluded rows.
Save validated findings to a note with the supporting source material nearby.
Export the output if the work needs to become a document or shared artifact.
Otio is not a replacement for a production data warehouse, a governed BI layer, or specialized statistical software. Use it when the data has to be interpreted alongside documents and notes. Use a BI platform for production dashboards; use a notebook or statistical package for advanced modeling; use a database pipeline when the work is operational.
If the main task is chart generation from research material, Otio’s AI data visualization workflow is the closest product fit.
[[OTIO_INLINE_PROMO:%7B%22title%22%3A%22Need%20to%20compare%20a%20CSV%20with%20supporting%20evidence%3F%22%2C%22description%22%3A%22Add%20your%20CSV%2C%20PDFs%2C%20web%20sources%2C%20and%20notes%20to%20Otio%2C%20then%20ask%20questions%20across%20them%20in%20one%20chat%20with%20cited%20answers.%22%7D]]
Best collaborative notebook option for technical data teams
18. Hex: best for SQL, Python, notebooks, and shared analysis
Hex is the best fit on this list for technical teams that want a collaborative notebook-style analytics workflow. It combines SQL, Python, visualizations, apps, and natural-language assistance in a shared environment.
That makes it stronger than chat-only CSV tools for reproducibility. Analysts can write queries, transform data, build charts, document methods, and publish interactive outputs. Teammates can review the logic rather than only reading a generated answer.
The setup may be disproportionate for a one-off CSV. Hex makes more sense when the team already works with databases, notebooks, or recurring analysis projects.
Use Hex when:
SQL or Python is part of the workflow.
Analysts need reviewable logic.
The output may become a shared app or report.
Collaboration matters more than instant simplicity.
For adjacent team workflows, see Otio’s overview of data collaboration tools.
How to compare CSV AI tools before uploading sensitive data
The most important evaluation happens before the upload. Many CSV failures are not model failures; they are input failures, permission failures, or reproducibility failures.
Use this checklist with any tool in the list.
Check the file handling details
Confirm:
Accepted formats: CSV, TSV, XLSX, Google Sheets, database tables, or compressed files.
Maximum upload size.
Row and column limits.
Number of files per chat, project, or workspace.
Encoding support, especially UTF-8 versus older encodings.
Behavior with large files: full processing, sampling, truncation, or failed upload.
Whether formulas are preserved if the file starts as XLSX.
Whether multiple CSVs can be joined or compared.
Do not assume a tool analyzed the full file. Ask it directly: “Did you process every row in the uploaded CSV? If not, what subset did you use?”
Test messy-data behavior
Use a small copied sample with known problems:
Blank cells.
Duplicate IDs.
Inconsistent date formats.
Mixed currencies.
Numbers stored as text.
Negative values.
Category spelling variants.
Non-UTF-8 characters.
Header rows that start below row one.
Notes or footers embedded after the data.
Ask the tool to identify problems before analysis. If it jumps straight to conclusions, slow it down.
Demand reproducible methods
For every answer, ask for:
Source columns used.
Filters applied.
Grouping level.
Date range.
Formula.
Denominator.
Units.
Rows excluded.
Code, if available.
Assumptions about missing values.
A good AI answer should be auditable. If it cannot show the method, treat it as a hypothesis.
Review privacy and retention
Before uploading confidential data, check:
Whether uploaded files may be used for training.
Retention and deletion controls.
Workspace permissions.
Admin controls.
Encryption claims.
Regional data requirements.
Sharing defaults.
Whether contractors, vendors, or external reviewers can access the workspace.
Whether the tool supports enterprise policies your organization requires.
For sensitive CSVs, remove direct identifiers unless they are necessary for the analysis. Replace names, emails, phone numbers, account IDs, and patient or client identifiers with stable pseudonymous keys where possible.
Check export formats
The analysis is not finished until it can leave the tool in the format the workflow needs.
Check whether exports support:
CSV.
XLSX.
PDF.
PNG or SVG charts.
Notebook code.
Dashboard links.
Slide-ready images.
Shareable reports.
Formulas and filters.
Chart labels and legends.
A screenshot is rarely enough for reviewable data work. Prefer exports that preserve the underlying calculation or chart configuration.
Run a verification pass
Before acting on the result:
Calculate a small sample manually.
Reconcile totals with the original file.
Compare row counts before and after cleaning.
Inspect outliers.
Check whether missing values were excluded.
Confirm denominators for percentages.
Preserve the original CSV unchanged.
Save prompts, assumptions, and final calculations.
For finance-specific use cases, this verification step is especially important. Otio has a separate comparison of AI financial statement analysis tools if your CSVs come from financial reports.
A practical CSV analysis workflow that works across tools
The safest workflow is boring by design. It separates understanding the file from drawing conclusions.
Step 1: Ask for schema and quality checks first
Start with:
What columns are present?
What data types do they appear to contain?
Which columns have missing values?
Are there duplicate rows or duplicate IDs?
Which date columns have inconsistent formats?
Which numeric columns may be stored as text?
Are there suspicious outliers?
Are there ambiguous column names?
Do not ask for conclusions until the tool has described the data.
Step 2: Separate descriptive, causal, and predictive questions
These are different jobs:
Descriptive: What happened?
Diagnostic: What changed across groups or time periods?
Causal: Why did it happen?
Predictive: What is likely to happen next?
A chart can describe a pattern. A correlation can suggest a relationship. Neither proves causation by itself.
If the question is causal, ask what additional design, controls, or evidence would be required. If the question is predictive, ask for training data, target variable, validation method, and evaluation metrics.
Step 3: Ask for the result and the method together
A weak prompt asks: “What was revenue growth?”
A better prompt asks: “Calculate revenue growth by quarter using the revenue column, grouping by invoice date, excluding canceled orders, and show the formula, filters, row count before and after filtering, and denominator used.”
That structure forces the tool to expose the method. It also gives a human reviewer something to check.
Step 4: Benchmark tools on the same file
Before committing to a tool, create a small benchmark CSV with known answers. Test each candidate on the same tasks:
Identify schema.
Count missing values.
Remove duplicates.
Calculate grouped totals.
Calculate percentage change.
Flag outliers.
Create one chart.
Export the result.
The best tool is not the one with the most confident prose. It is the one that handles your actual file correctly, explains its work, and fits the export and privacy requirements.
Step 5: Choose the simplest tool that meets the workflow
If Excel with Copilot solves the problem, do not build a BI pipeline. If a Power BI dashboard will become the operating metric for a team, do not leave it in a chat transcript. If a CSV has to be interpreted alongside papers, PDFs, and notes, do not isolate it from the evidence.
A useful rule: choose the lightest tool that still gives you reviewable calculations, acceptable privacy controls, and the required output format.
FAQ
Q: Can AI analyze a CSV with messy or inconsistent data?
A: Often, but the tool should identify missing values, duplicates, inconsistent dates, and mixed data types before analysis. Review and correct the cleaned data yourself because an AI may silently infer the wrong format or exclude rows.
Q: What CSV file size is best for AI analysis?
A: There is no universal limit: it varies by tool, plan, model, and whether the file is processed in full or sampled. Check the current provider documentation and test whether totals from the AI match a known calculation on your dataset.
Q: How can I make AI-generated CSV results reproducible?
A: Ask for the exact filters, formulas, code, grouping logic, assumptions, and excluded rows, then save the original file and the analysis instructions together. Re-run the calculation in a spreadsheet, notebook, or approved reporting system before using it for a consequential decision.
[[OTIO_FOOTER_PROMO:%7B%22title%22%3A%22Apply%20this%20workflow%20to%20your%20own%20files%22%2C%22description%22%3A%22Bring%20a%20CSV%20and%20its%20related%20reports%2C%20notes%2C%20or%20web%20sources%20into%20Otio%20to%20check%20calculations%20and%20interpret%20results%20in%20context.%22%7D]]