
Study Skills
30 Graphic Organizer Examples for Essays, Science, and History
Find 30 graphic organizer examples for brainstorming essays, explaining science, studying history, and reviewing complex topics. Choose the right visual structure for your assignment and fill it in effectively.

A graphic organizer is useful when the assignment has a shape: an argument, a sequence, a comparison, a hierarchy, a cycle, or a set of causes and effects. Pick the organizer that matches the thinking task, not the subject label.
For essays, use claim-evidence-reasoning charts, outlines, and compare-and-contrast matrices. For science, use flowcharts, lab organizers, concept maps, cycles, and classification charts. For history, use timelines, source-analysis charts, cause-and-effect maps, and continuity/change organizers.
How to choose the right graphic organizer
Use a graphic organizer to make relationships visible before you write, study, or explain. A list can hold facts, but a graphic organizer shows how facts connect.
Florida State University’s Academic Center for Excellence groups graphic organizers by subject area, but the more reliable rule is to choose by reasoning task: sequence, comparison, hierarchy, causation, evidence, or review. Frederick Community College’s writing guide similarly treats organizers and outlines as tools for structuring a paper before drafting.
If the assignment asks you to… | Use this organizer type | Good examples |
|---|---|---|
Explain steps or events | Sequence | Timeline, flowchart, cycle diagram |
Compare two or more things | Comparison | Venn diagram, T-chart, matrix |
Break a topic into categories | Hierarchy | Tree diagram, classification chart |
Prove a point | Argument | Essay outline, CER chart, argument map |
Study a large topic | Review | Cornell notes, Frayer model, concept matrix |
Explain why something happened | Causation | Cause-and-effect map, problem-solution organizer |
Start with the simplest structure that fits. If a T-chart answers the prompt, do not build a 12-column spreadsheet.
Fill the organizer with keywords and short phrases first. Complete sentences come later, when you turn the organizer into an essay, study guide, lab report, or presentation.
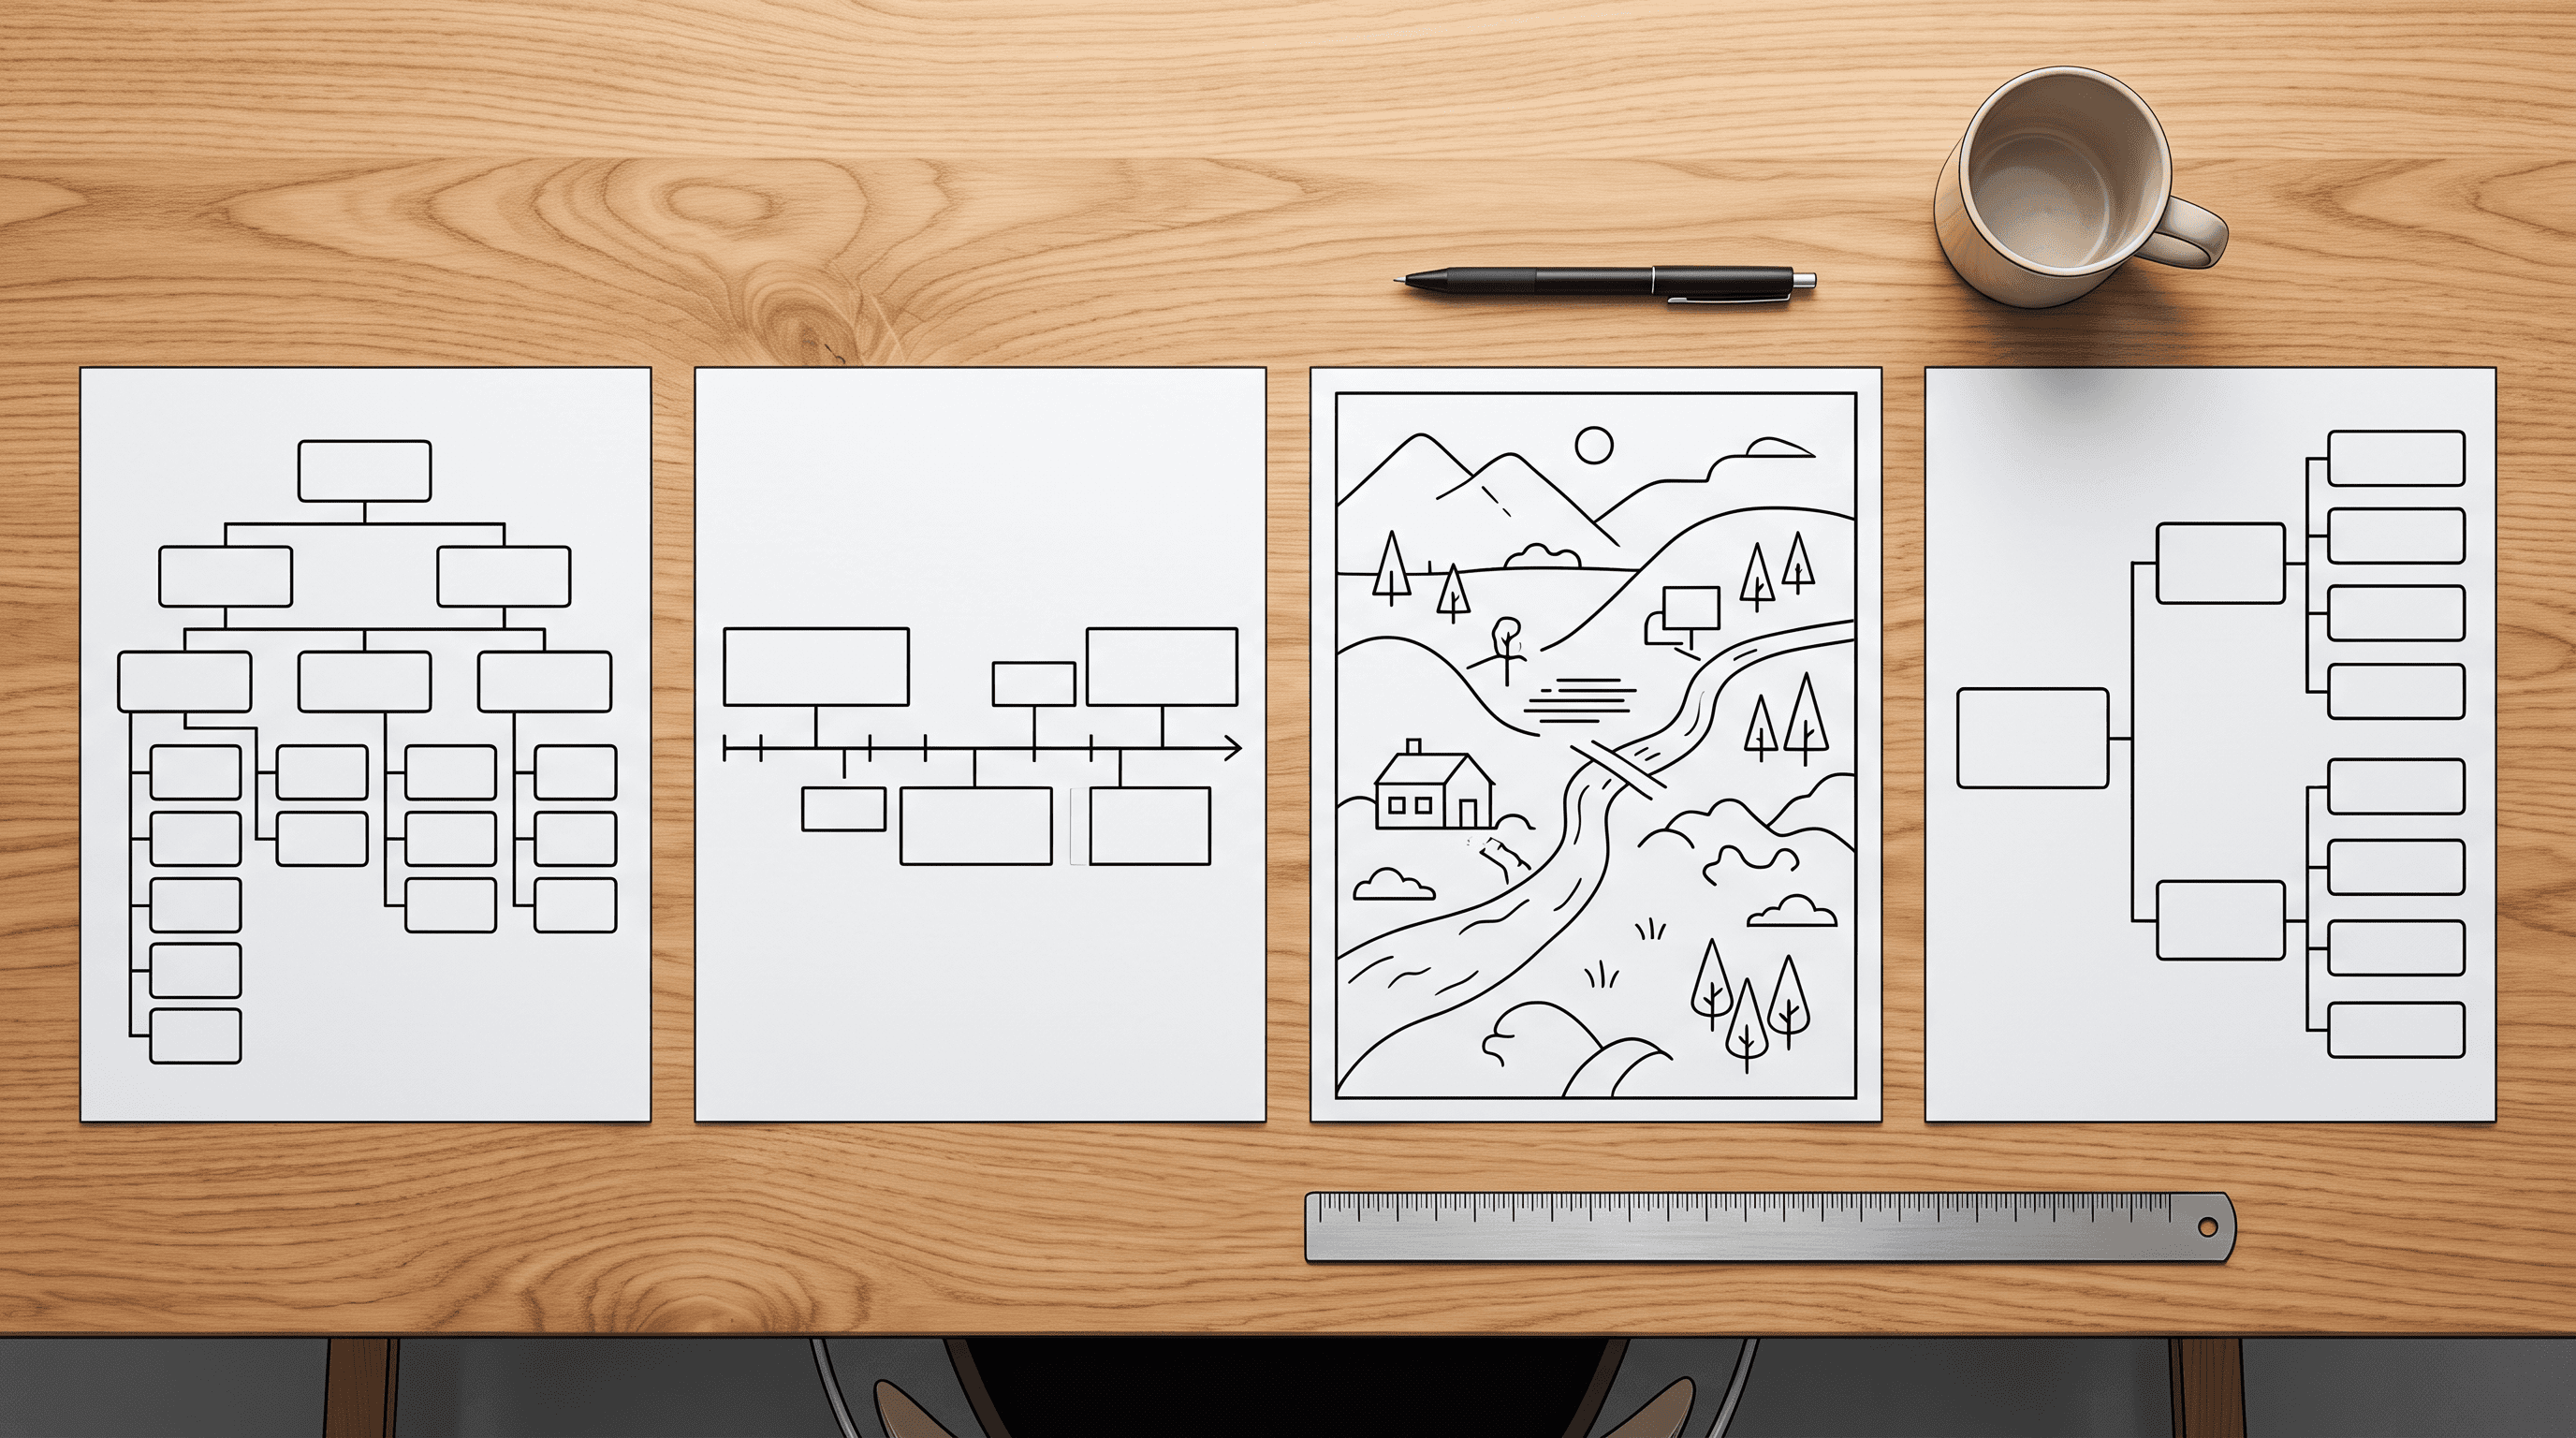
Graphic organizers for essays and written arguments
Essay organizers are not just prewriting worksheets. Used well, they force a draft to answer three questions before the first paragraph exists: What is the point? What proves it? Why does the proof matter?
If you are working with sources, keep page numbers or source titles beside evidence from the start. It prevents the common problem of having a polished argument with untraceable quotations.
For more essay-specific templates, Otio also has a guide to research essay graphic organizer templates and a separate walkthrough on building a research paper graphic organizer.
1. Essay outline organizer
Use an essay outline organizer when the task is to move from a prompt to a draft. The usual fields are thesis, introduction, main point 1, evidence, analysis, main point 2, evidence, analysis, conclusion.
A strong version includes a box for the so what? after each body paragraph. That keeps the organizer from becoming a pile of quotations.
Best for: literary analysis, research essays, analytical essays, response papers.
2. Claim-evidence-reasoning chart
A claim-evidence-reasoning chart, often shortened to CER, connects each claim to evidence and then explains the reasoning. The reasoning column is the part students often skip, and it is the part that turns a fact into an argument.
Use three columns:
Claim: What you are arguing
Evidence: The quote, data point, example, or observation
Reasoning: How the evidence supports the claim
Best for: argumentative essays, science explanations, DBQs, source-based paragraphs.
3. Five-paragraph essay organizer
A five-paragraph organizer maps the introduction, three body paragraphs, and conclusion. It is formulaic, but that is the point: it helps early writers control structure before experimenting.
Use it when the assignment is short and focused. Do not force it onto a college research paper or a complex argument with more than three major sections.
Best for: timed writing, middle school and high school essays, standardized test practice.
4. Persuasive essay organizer
A persuasive essay organizer separates position, reasons, evidence, counterargument, rebuttal, and call to action. That structure makes the argument less one-sided.
A good persuasive organizer includes at least one box for the opposing view. If the rebuttal is weak, the organizer reveals the problem before the draft does.
Best for: opinion essays, policy arguments, editorials, debate prep.
5. Compare-and-contrast matrix
A compare-and-contrast matrix puts subjects in columns and criteria in rows. This is better than a Venn diagram when you need more precision.
For example, if you are comparing two novels, your rows might be narrator, setting, conflict, theme, symbolism, and ending. If you are comparing two policies, use cost, benefits, tradeoffs, stakeholders, and evidence.
Best for: comparative essays, literature essays, policy analysis, source comparison.
6. Cause-and-effect essay map
A cause-and-effect map traces a main cause, contributing factors, immediate effects, and long-term consequences. It helps avoid the lazy “X caused Y” structure when the real answer is more complex.
Use arrows carefully. Each arrow should mean “contributed to,” “triggered,” “led to,” or “worsened,” not just “is related to.”
Best for: history essays, social science papers, environmental issues, public health topics.
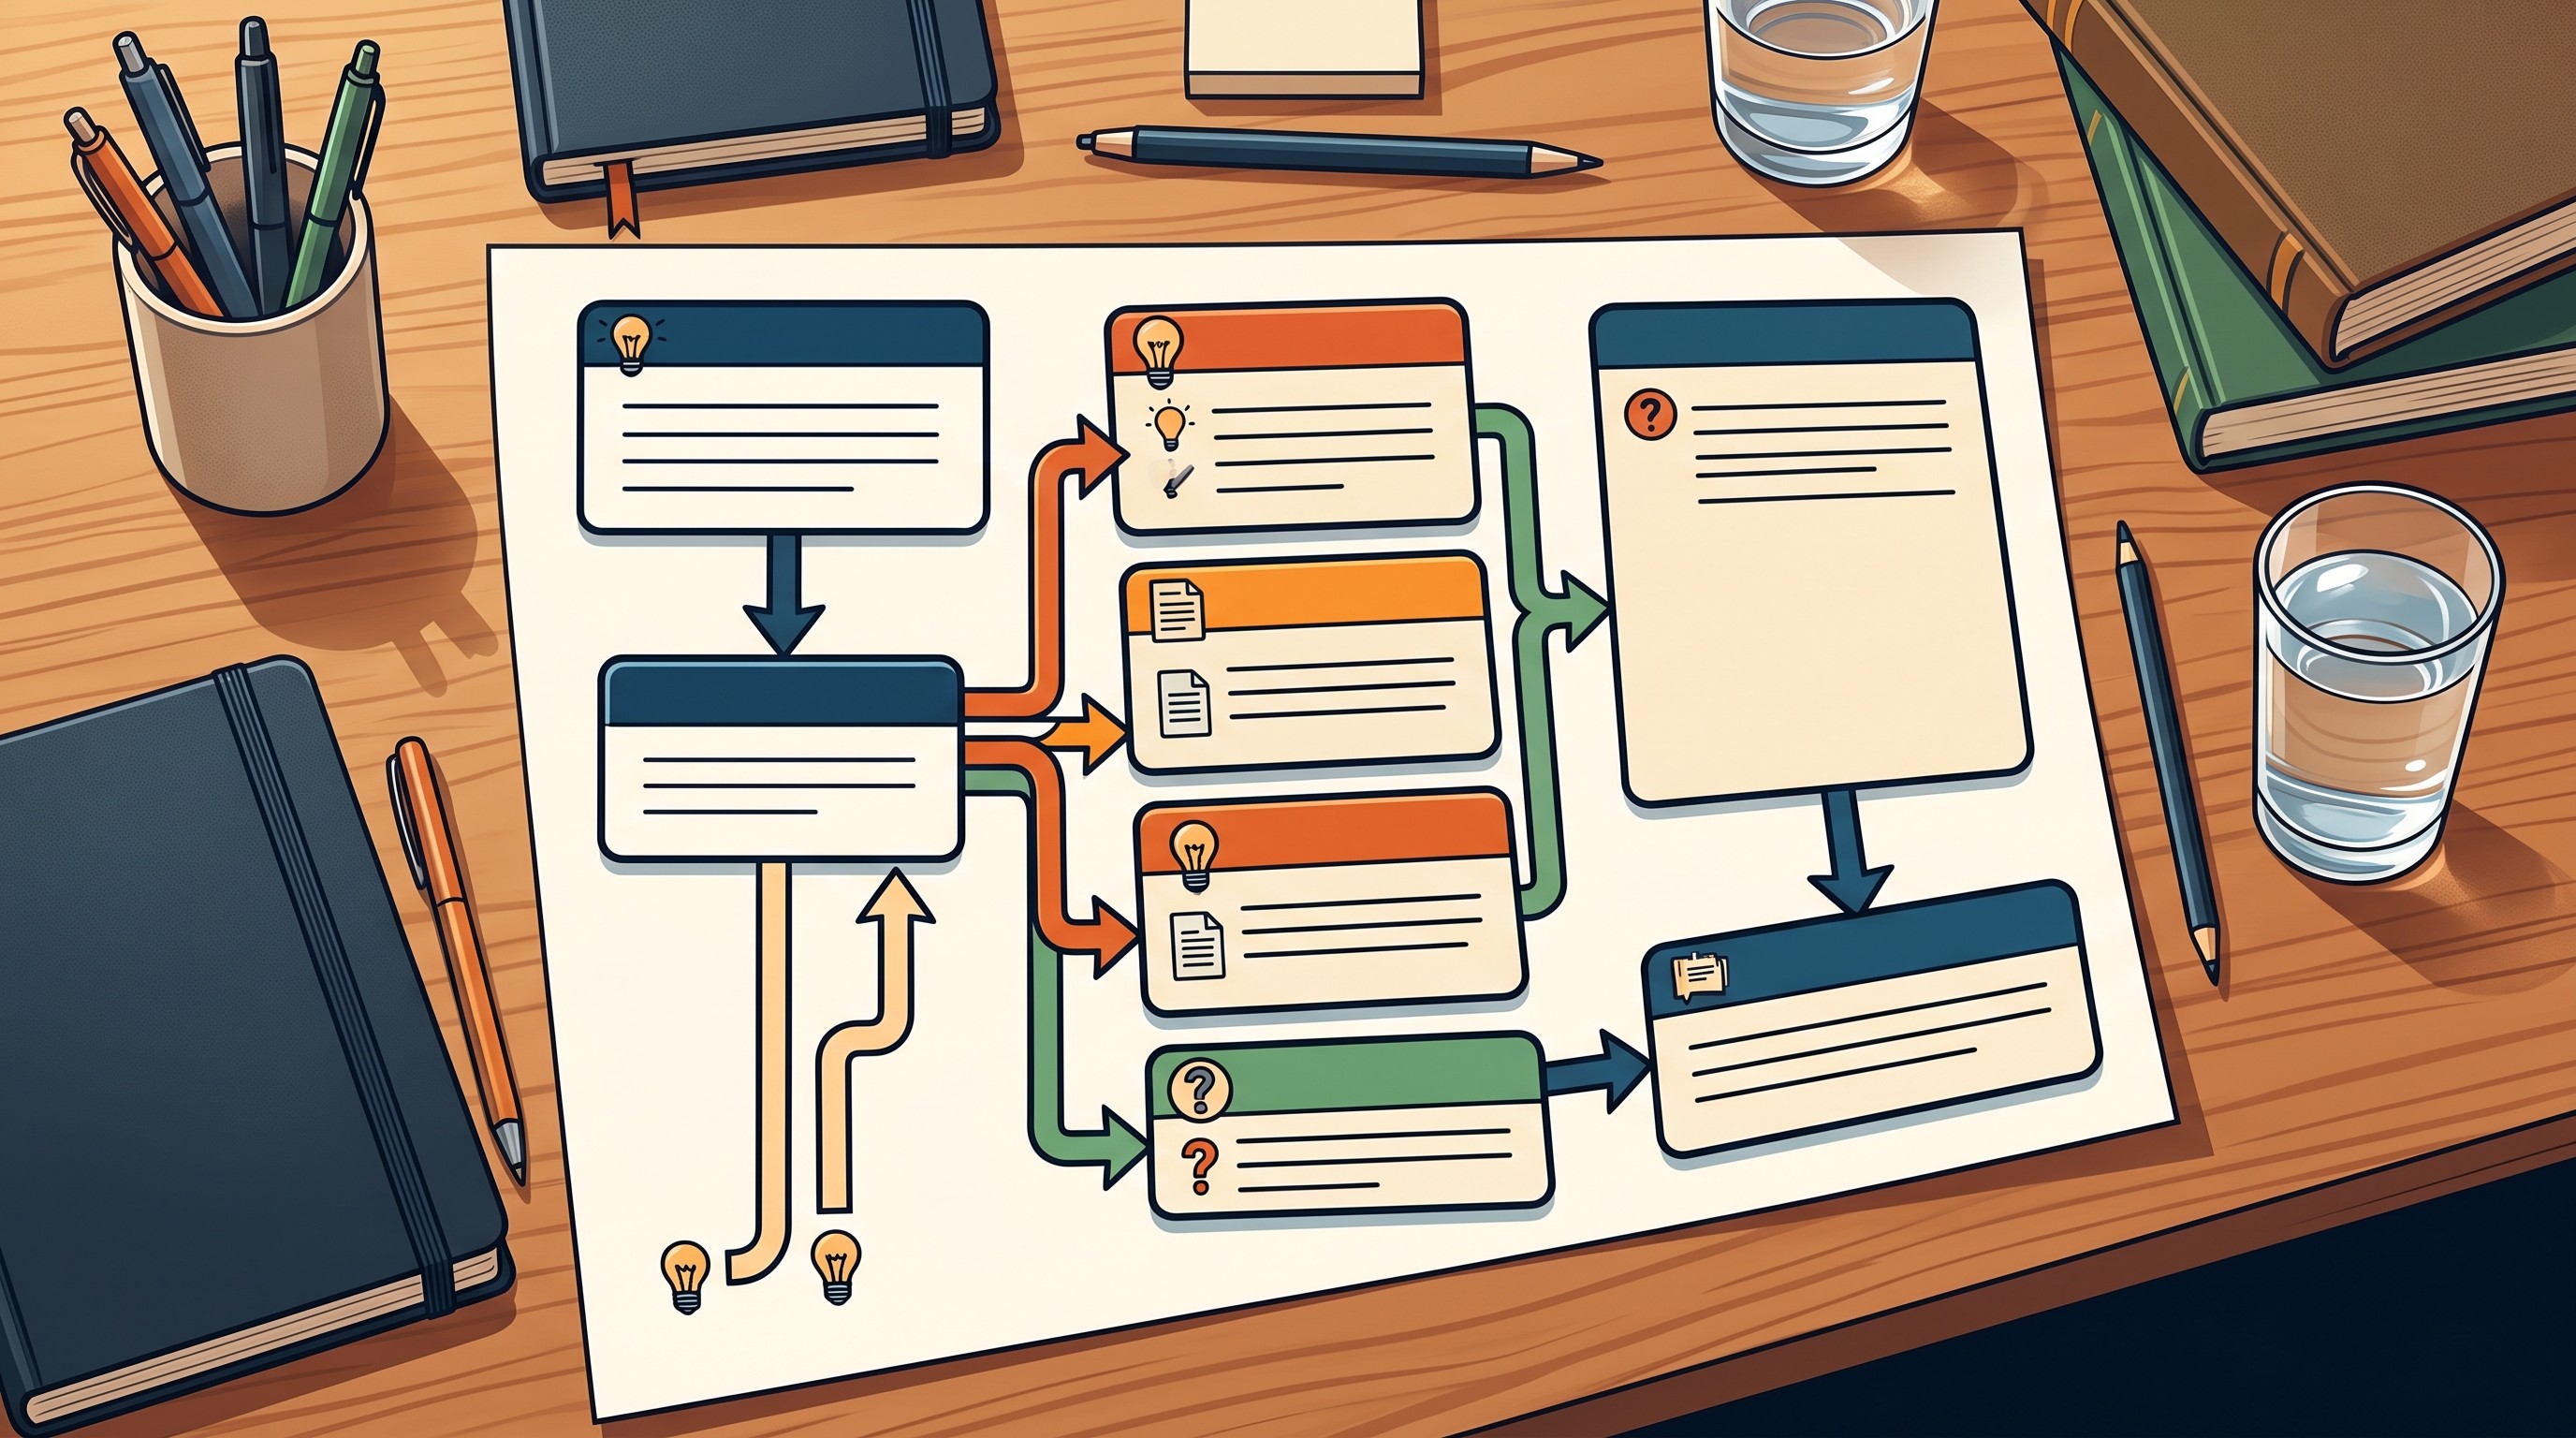
Graphic organizers for science classes
Science organizers work best when they show process, classification, or relationships. The goal is not decoration. It is to make variables, systems, and evidence easier to inspect.
For research-based science assignments, a tool like Otio’s AI PDF reader can help keep papers, textbook chapters, highlights, and notes in one workspace while you build the organizer separately.
7. Scientific method flowchart
A scientific method flowchart shows the movement from observation to question, hypothesis, experiment, data, analysis, and conclusion. Science Buddies describes the scientific method as a sequence that includes asking a question, doing background research, constructing a hypothesis, testing it, and analyzing results.
The best flowcharts also include a loop. If the data does not support the hypothesis, the next step may be a revised hypothesis or a new experiment.
Best for: science fair projects, lab planning, experimental design.
8. Lab report organizer
A lab report organizer prepares the report before the writing begins. Use fields for purpose, hypothesis, independent variable, dependent variable, controlled variables, materials, procedure, results, sources of error, and conclusion.
The variables section matters most. If the independent and dependent variables are unclear in the organizer, the lab report will usually be unclear too.
Best for: biology, chemistry, physics, environmental science labs.
9. Concept map
A concept map starts with a central term and branches into related terms, examples, processes, and relationships. Unlike a mind map, a concept map should label the relationship between ideas.
For photosynthesis, branches might include chloroplasts, light energy, carbon dioxide, water, glucose, oxygen, and the relationship between reactants and products.
Best for: ecosystems, cell biology, chemistry units, physics concepts.
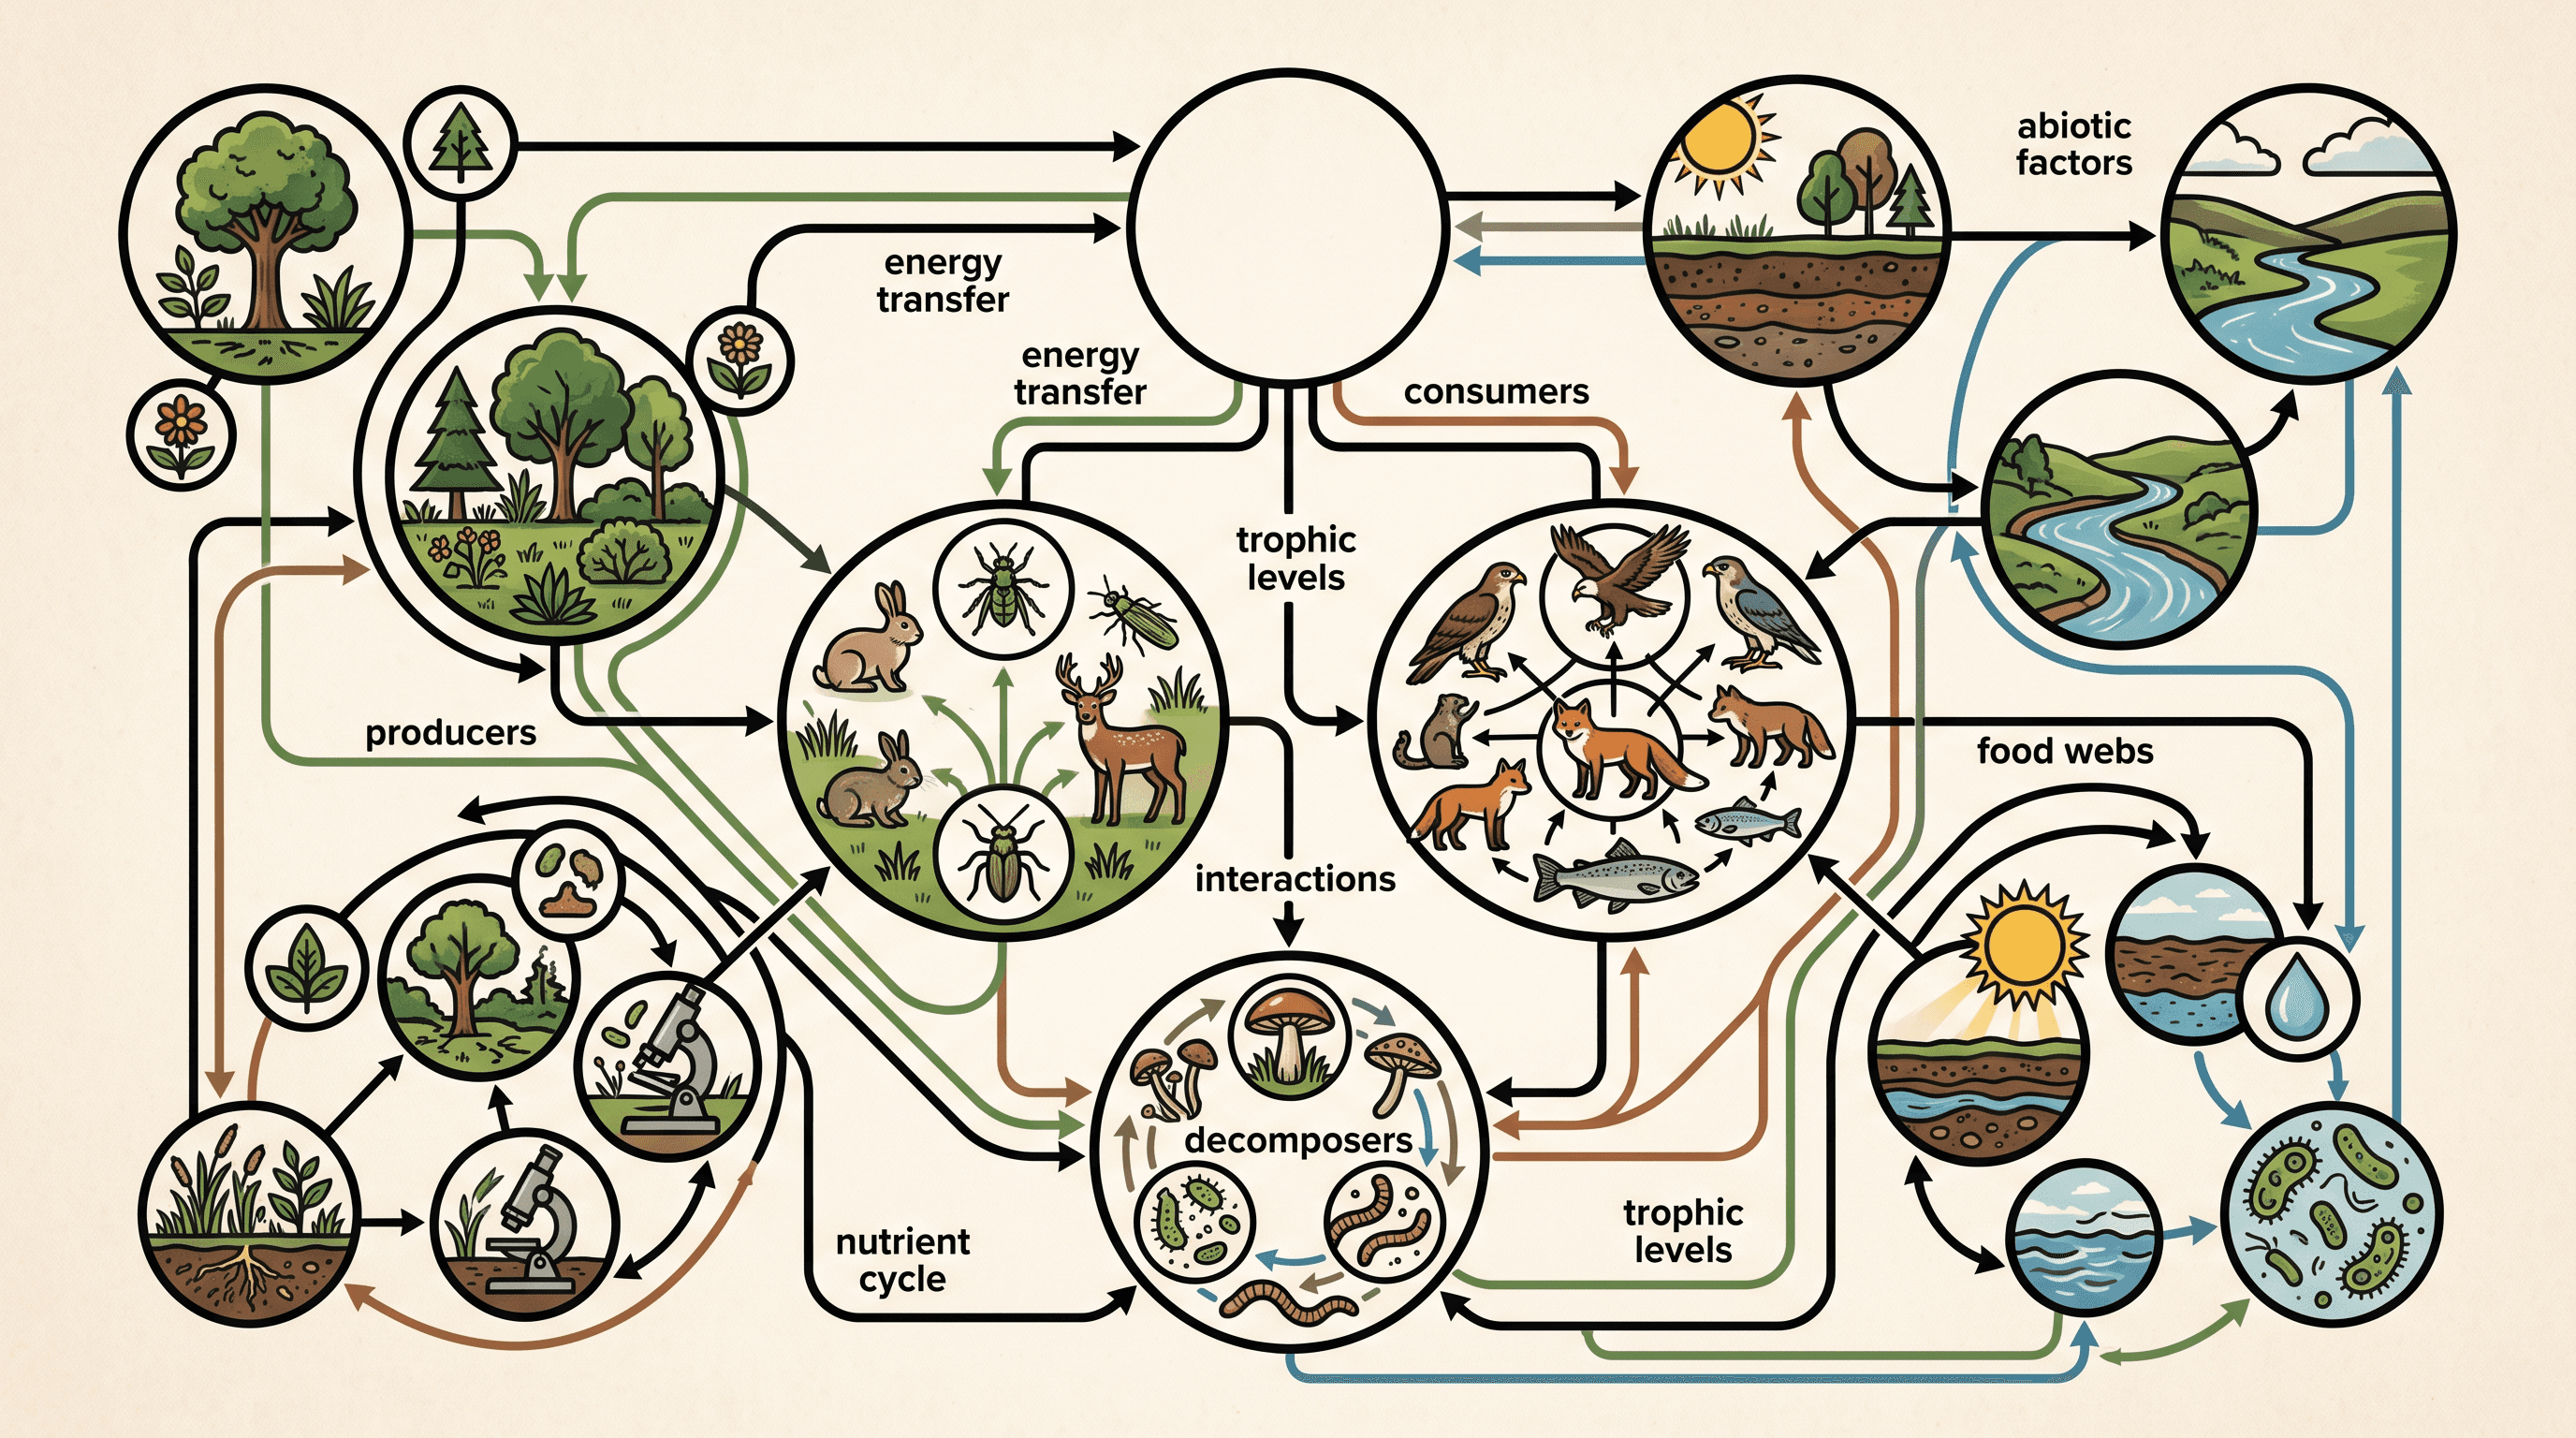
10. Food web organizer
A food web organizer arranges producers, consumers, and decomposers, then uses arrows to show energy flow. The arrows should point in the direction energy moves, not toward the animal that “wins.”
A simple version might include grass, grasshopper, frog, snake, hawk, fungi, and bacteria. A more advanced version can show multiple feeding paths and what happens when one species declines.
Best for: ecology, ecosystems, environmental science.
11. Cycle diagram
A cycle diagram illustrates a repeating process. Common examples include the water cycle, carbon cycle, nitrogen cycle, rock cycle, cell cycle, and life cycles.
Use a cycle diagram only when the process repeats. If the process has a clear start and end, a flowchart is usually better.
Best for: earth science, biology, environmental systems.
12. Classification chart
A classification chart sorts items into groups using shared characteristics. It can move from broad categories to narrower ones, such as kingdom, phylum, class, order, family, genus, species.
Classification charts also work outside biology. Chemistry students can classify matter as elements, compounds, mixtures, homogeneous mixtures, and heterogeneous mixtures.
Best for: taxonomy, rocks and minerals, cell types, chemical substances.
[[OTIO_INLINE_PROMO:%7B%22title%22%3A%22Need%20to%20connect%20lab%20evidence%20to%20your%20organizer%3F%22%2C%22description%22%3A%22Keep%20science%20papers%2C%20textbook%20chapters%2C%20highlights%2C%20and%20notes%20together%20in%20Otio%20while%20you%20build%20a%20lab%20or%20concept%20organizer.%22%7D]]
Graphic organizers for history and social studies
History organizers should do more than place events in order. The stronger ones show causation, perspective, continuity, change, and evidence.
A date by itself is rarely enough. Add turning points, motives, constraints, and consequences.
13. History timeline
A timeline places events in chronological order, usually with dates and short notes. Storyboard That defines a timeline as a graphic organizer that represents events in chronological order, often in a linear format.
A useful history timeline includes more than “what happened.” Add why each event matters, what caused it, and what changed afterward.
Best for: wars, reform movements, political eras, biographies.
14. Historical cause-and-effect chart
This chart links background conditions, triggering events, short-term effects, and long-term outcomes. It is especially useful when a timeline is too flat.
For the French Revolution, for example, background conditions might include social inequality and debt; triggers might include food shortages and political crisis; outcomes might include the fall of the monarchy and later Napoleonic rule.
Best for: revolutions, wars, economic crises, social movements.
15. Compare-and-contrast chart for historical figures
This organizer compares leaders or thinkers by the same criteria. Possible rows include beliefs, goals, methods, policies, supporters, opposition, achievements, and limitations.
Use shared criteria across both figures. If one column has “economic policy” and the other has “personality,” the comparison will not produce a coherent paragraph.
Best for: presidents, reformers, philosophers, military leaders.
16. Primary-source analysis organizer
A primary-source analysis organizer records author, audience, purpose, historical context, main claim, evidence, tone, and possible bias or perspective. This is one of the most useful history organizers because it slows down interpretation.
Do not treat “bias” as a synonym for “false.” In primary-source work, perspective is evidence. The question is what the source can and cannot reliably show.
Best for: letters, speeches, diaries, government documents, newspaper articles.
17. Political cartoon analysis chart
A political cartoon chart identifies symbols, labels, exaggeration, irony, historical references, audience, and message. It helps students separate what they see from what the cartoon argues.
Use two passes. First, list visible details. Then interpret what those details suggest.
Best for: political history, media literacy, civics, AP history courses.
18. Continuity-and-change-over-time chart
A continuity-and-change-over-time chart divides a period into before, during, and after. It tracks what changed and what stayed consistent.
This organizer is especially useful because students often overstate change. A revolution may change leadership while leaving class structures, gender roles, or economic patterns partly intact.
Best for: AP history essays, long-period historical analysis, social change topics.

Graphic organizers for studying and reviewing
Study organizers should support retrieval, not just storage. If the page only looks neat, it is not doing enough work.
The Cornell Learning Strategies Center describes the Cornell Note Taking System as one option among note-taking systems that students can adapt to their situation. The key idea is to divide notes so review becomes active rather than passive.
For long readings, textbook chapters, or PDFs, Otio’s AI textbook summarizer can help produce a first-pass summary, but the organizer should still be checked against the original material.
19. Cornell notes organizer
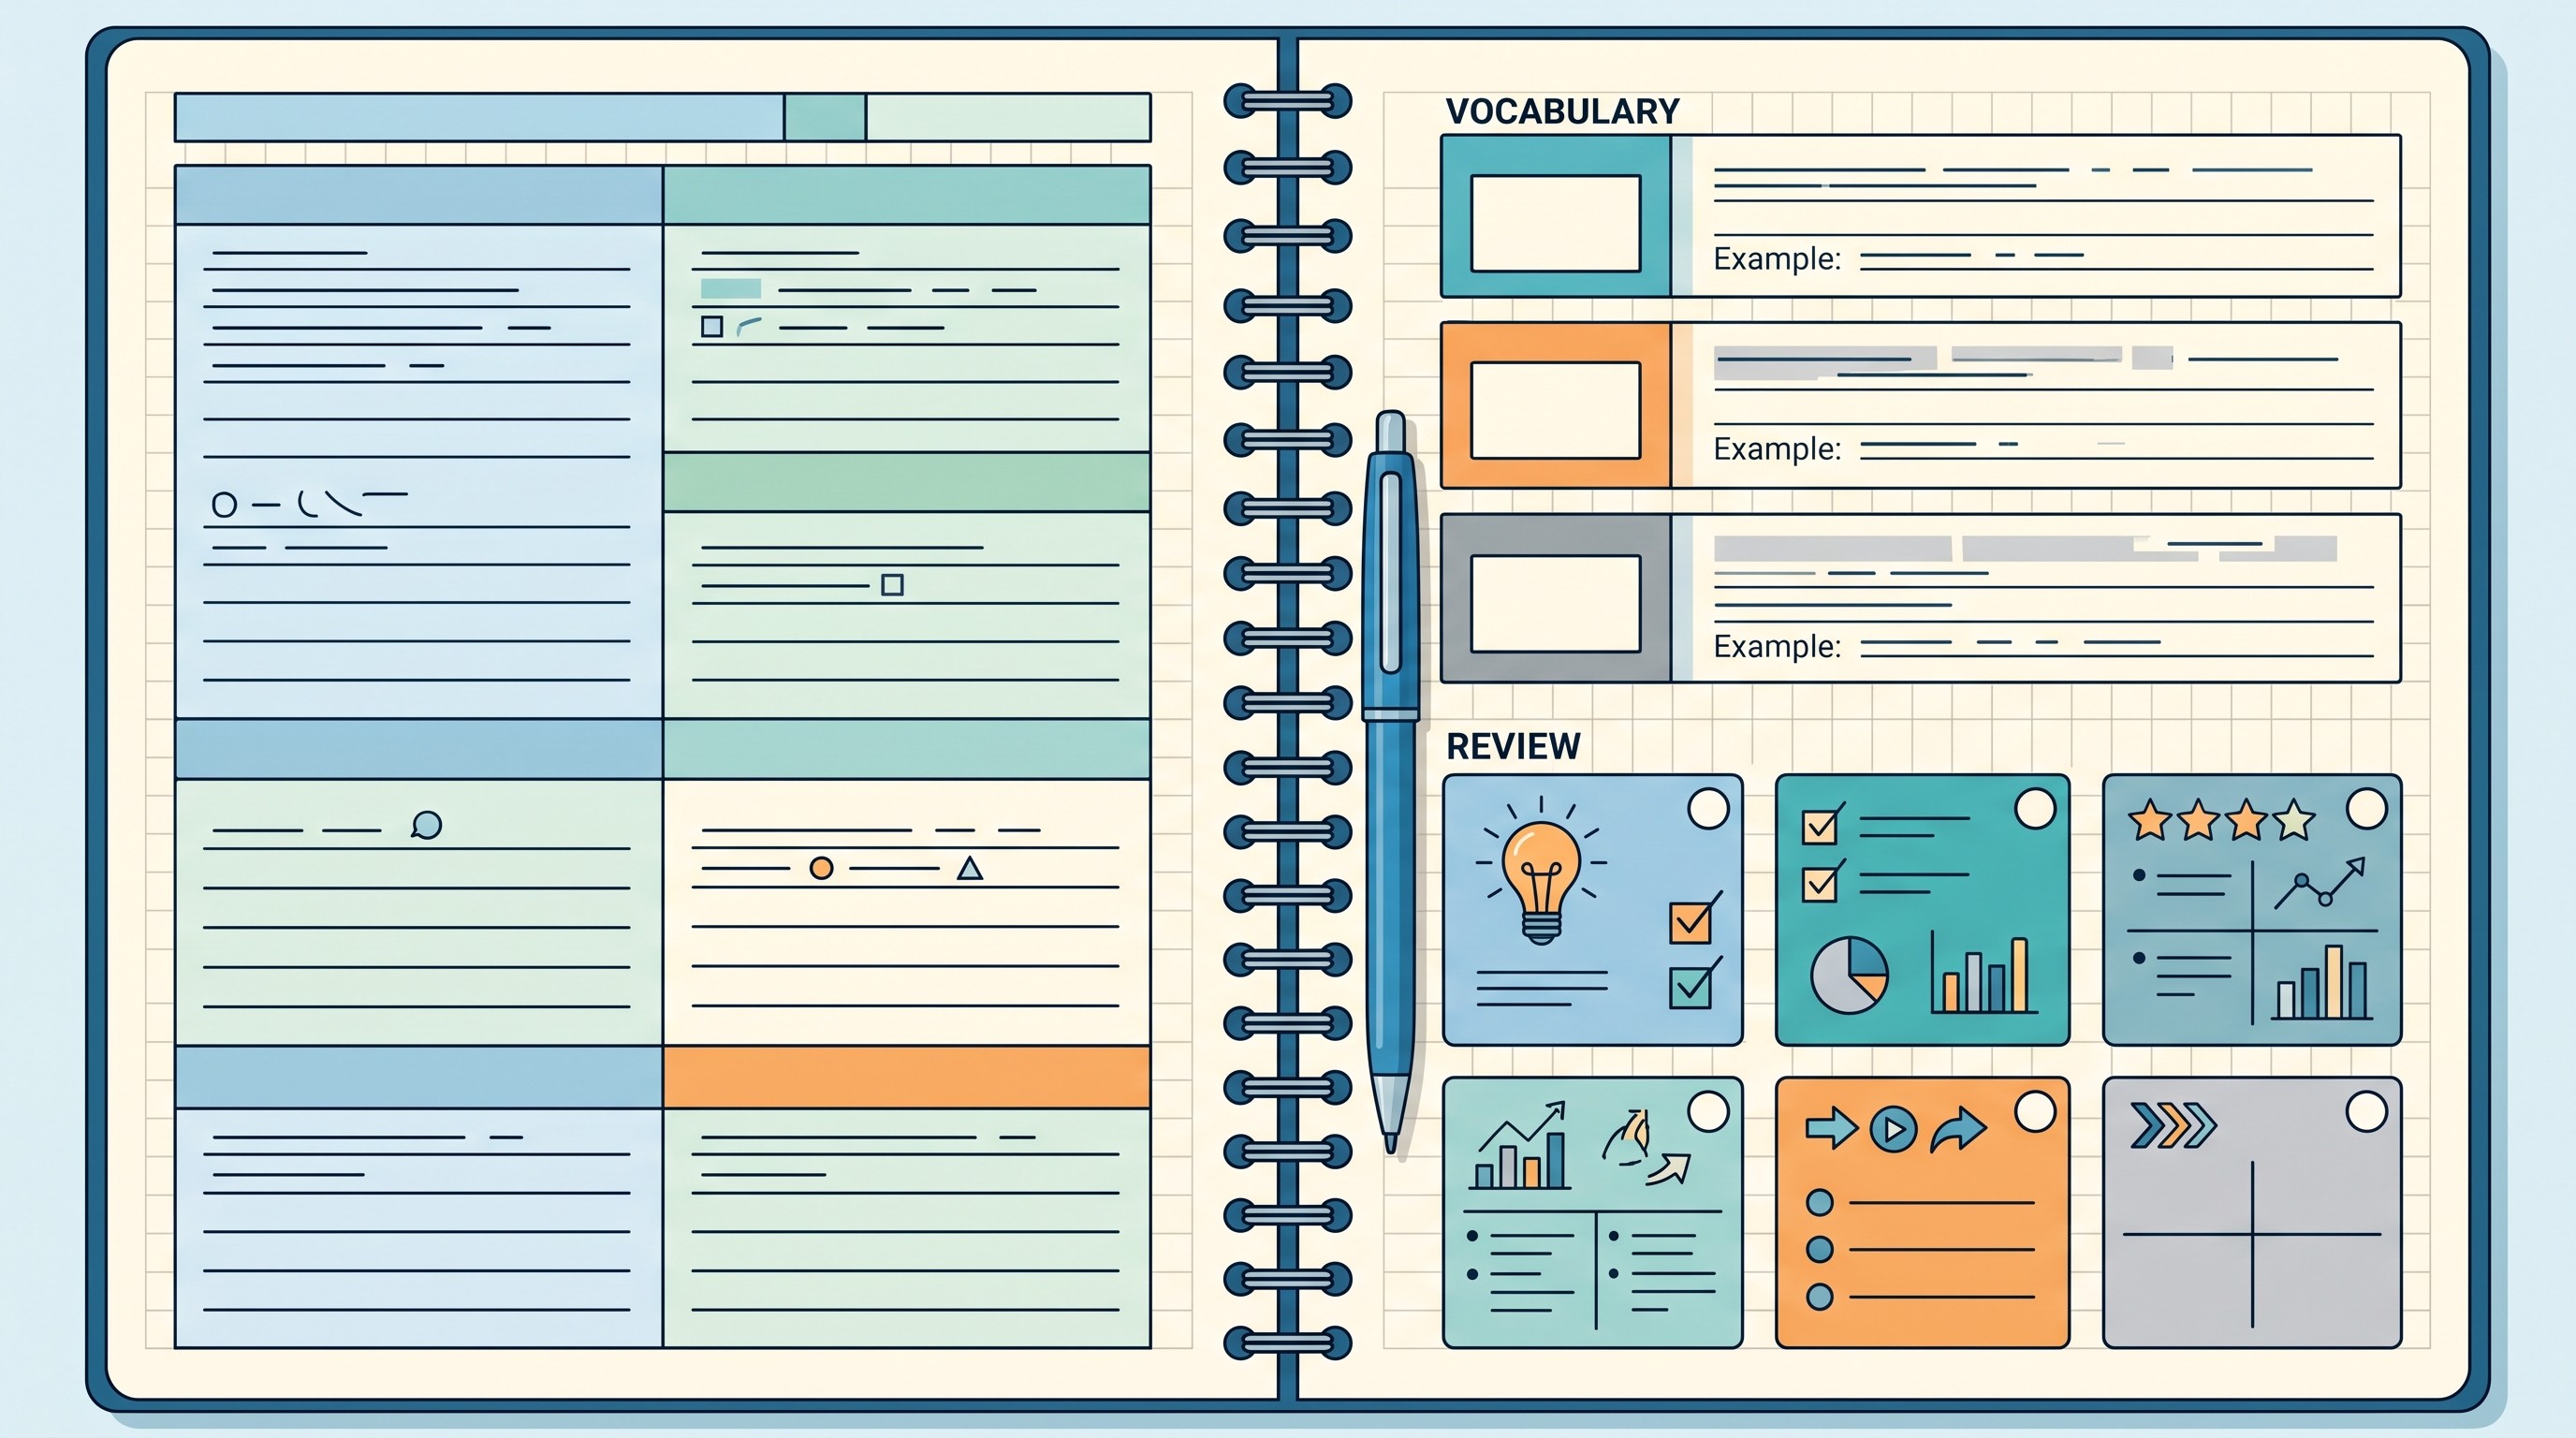
Cornell notes divide the page into a notes area, cue-question area, and summary area. During class or reading, take notes in the main section. Afterward, add questions in the cue column and write a short summary at the bottom.
The cue column is not decoration. It turns the page into a self-quiz.
Best for: lectures, textbook chapters, exam review.
20. Chapter summary chart
A chapter summary chart captures the central idea, key terms, important details, examples, and unanswered questions. It works well when a textbook chapter is dense but organized.
Keep the “unanswered questions” box. It helps separate what you understand from what merely looks familiar.
Best for: textbook-heavy courses, independent reading, test preparation.
21. Frayer model
The Frayer model is a vocabulary organizer with four parts: definition, characteristics, examples, and nonexamples. It is useful because knowing what a term is not often sharpens what it is.
For “democracy,” examples might include representative democracy and direct democracy; nonexamples might include monarchy or dictatorship. The contrast prevents vague definitions.
Best for: vocabulary, science terms, social studies concepts, math definitions.
22. KWL chart
A KWL chart records what you Know, what you Want to know, and what you Learned. Use it before and after a lesson, reading, or research session.
The “Want to know” column is the most valuable part. It turns reading into a search for answers rather than a passive scan.
Best for: new units, research projects, reading nonfiction.
23. Question-and-answer review grid
A question-and-answer grid turns headings, learning objectives, or lecture topics into questions. Write the answers from memory before checking the text.
This is better than rereading because it exposes gaps. If the answer cannot be produced without looking, the material is not secure yet.
Best for: exam review, active recall, study guides.
24. Exam concept matrix
An exam concept matrix puts topics in rows and comparison criteria in columns. Useful columns include definition, formula, example, common error, related concept, and confidence level.
The confidence column is practical. Mark each topic high, medium, or low, then study the low-confidence rows first.
Best for: cumulative exams, STEM courses, medical and law school review.
Cross-subject graphic organizers for complex ideas
Some organizers work in almost every subject because they handle common reasoning patterns. Use these when the assignment is broad, messy, or still unclear.
If the project grows into a full research paper, see Otio’s guide to research notes graphic organizer templates for ways to keep sources and ideas traceable.
25. Mind map
A mind map starts with a central topic and branches into themes, subtopics, examples, questions, and vocabulary. It is best for early brainstorming when the structure is not obvious yet.
Do not stop at the first ring of branches. The useful ideas often appear in the second or third layer.
Best for: brainstorming, project planning, research topic development.
26. Problem-solution organizer
A problem-solution organizer defines the problem, causes, effects, possible solutions, tradeoffs, and recommended solution. It is stronger than a simple pros-and-cons list because it keeps the problem visible.
Use it to test whether a proposed solution actually addresses the cause or only treats a symptom.
Best for: policy essays, design projects, business cases, civic issues.
27. Sequence-of-events chart
A sequence chart breaks a process, story, experiment, or historical development into ordered steps. Each step should include what happens and what changes.
This works better than a timeline when exact dates are less important than order.
Best for: procedures, plot events, experiments, historical developments.
28. Hierarchy or tree diagram
A hierarchy diagram organizes a broad subject into categories, subcategories, and examples. It shows which ideas belong under larger ideas.
For example, “government” might branch into democracy, monarchy, dictatorship, and theocracy, with further branches under each. In science, “matter” might branch into pure substances and mixtures.
Best for: classification, outlining, taxonomy, organizational structure.
29. T-chart
A T-chart compares two sides of an issue. Common versions include advantages/disadvantages, facts/opinions, observations/inferences, and arguments/counterarguments.
Its strength is speed. Its weakness is oversimplification, so use a matrix if the comparison needs more than two columns.
Best for: quick comparison, debate prep, reading response, decision-making.
30. Argument map
An argument map displays the central conclusion, supporting reasons, evidence, assumptions, objections, and responses. It is more flexible than a standard outline because it shows how claims depend on each other.
Use an argument map when the logic matters more than paragraph order. Once the map is sound, convert it into an outline.
Best for: philosophy, research papers, debate, policy analysis, literature reviews.

How to use a graphic organizer without overcomplicating the assignment
Write the assignment question or learning objective at the top. Every box should help answer that question.
Use one idea per box or branch. Short entries are better than crowded paragraphs because the organizer needs to stay scannable during revision.
Mark gaps instead of hiding them. Use a question mark, highlight, or different color for missing evidence, uncertain links, weak reasoning, or facts that need checking.
For source-based work, record the source title, author, page number, paragraph number, timestamp, or URL beside important evidence. This is the difference between useful prewriting and a scavenger hunt later.
After completing the organizer, inspect it for four problems:
Gaps: Is a claim missing evidence?
Repetition: Are two sections saying the same thing?
Weak order: Would the sequence make more sense another way?
Unsupported links: Does an arrow imply causation when you only have correlation?
Then turn the organizer into the next deliverable. An essay organizer becomes an outline. A lab organizer becomes a report. A Cornell notes page becomes a review quiz. A concept matrix becomes a study plan.
The organizer is finished when it makes the next step easier. If you are spending more time formatting boxes than improving the ideas, simplify it.
FAQ
Q: Should I use a graphic organizer before or after reading?
A: Use it before reading when you need to predict, plan, or identify questions. Use it during or after reading when you need to sort evidence, summarize ideas, or compare what you learned with your initial expectations.
Q: Can graphic organizers be used for college assignments?
A: Yes. College students can use them to plan research papers, map arguments, compare sources, analyze experiments, and prepare for exams. The organizer should match the assignment’s reasoning task, not merely summarize the topic.
Q: Are digital graphic organizers better than paper ones?
A: Neither format is always better. Paper is faster for rough brainstorming; digital organizers are easier to edit, duplicate, search, and share.
Q: How do I know when an organizer is too complicated?
A: If you spend more time arranging boxes than developing ideas, the structure is too complex. Remove fields that do not help you answer the question, organize evidence, or remember the material.
[[OTIO_FOOTER_PROMO:%7B%22title%22%3A%22Ready%20to%20apply%20one%20to%20your%20sources%3F%22%2C%22description%22%3A%22Add%20your%20PDFs%2C%20web%20pages%2C%20or%20notes%20to%20Otio%20and%20ask%20questions%20across%20them%20as%20you%20turn%20evidence%20into%20an%20organizer.%22%7D]]