
Research Methodology
25 Research Design Examples for Thesis Writers (With Variables and Methods)
Compare 25 research design examples by purpose, variables, methods, and limitations so you can choose and adapt a defensible thesis design.

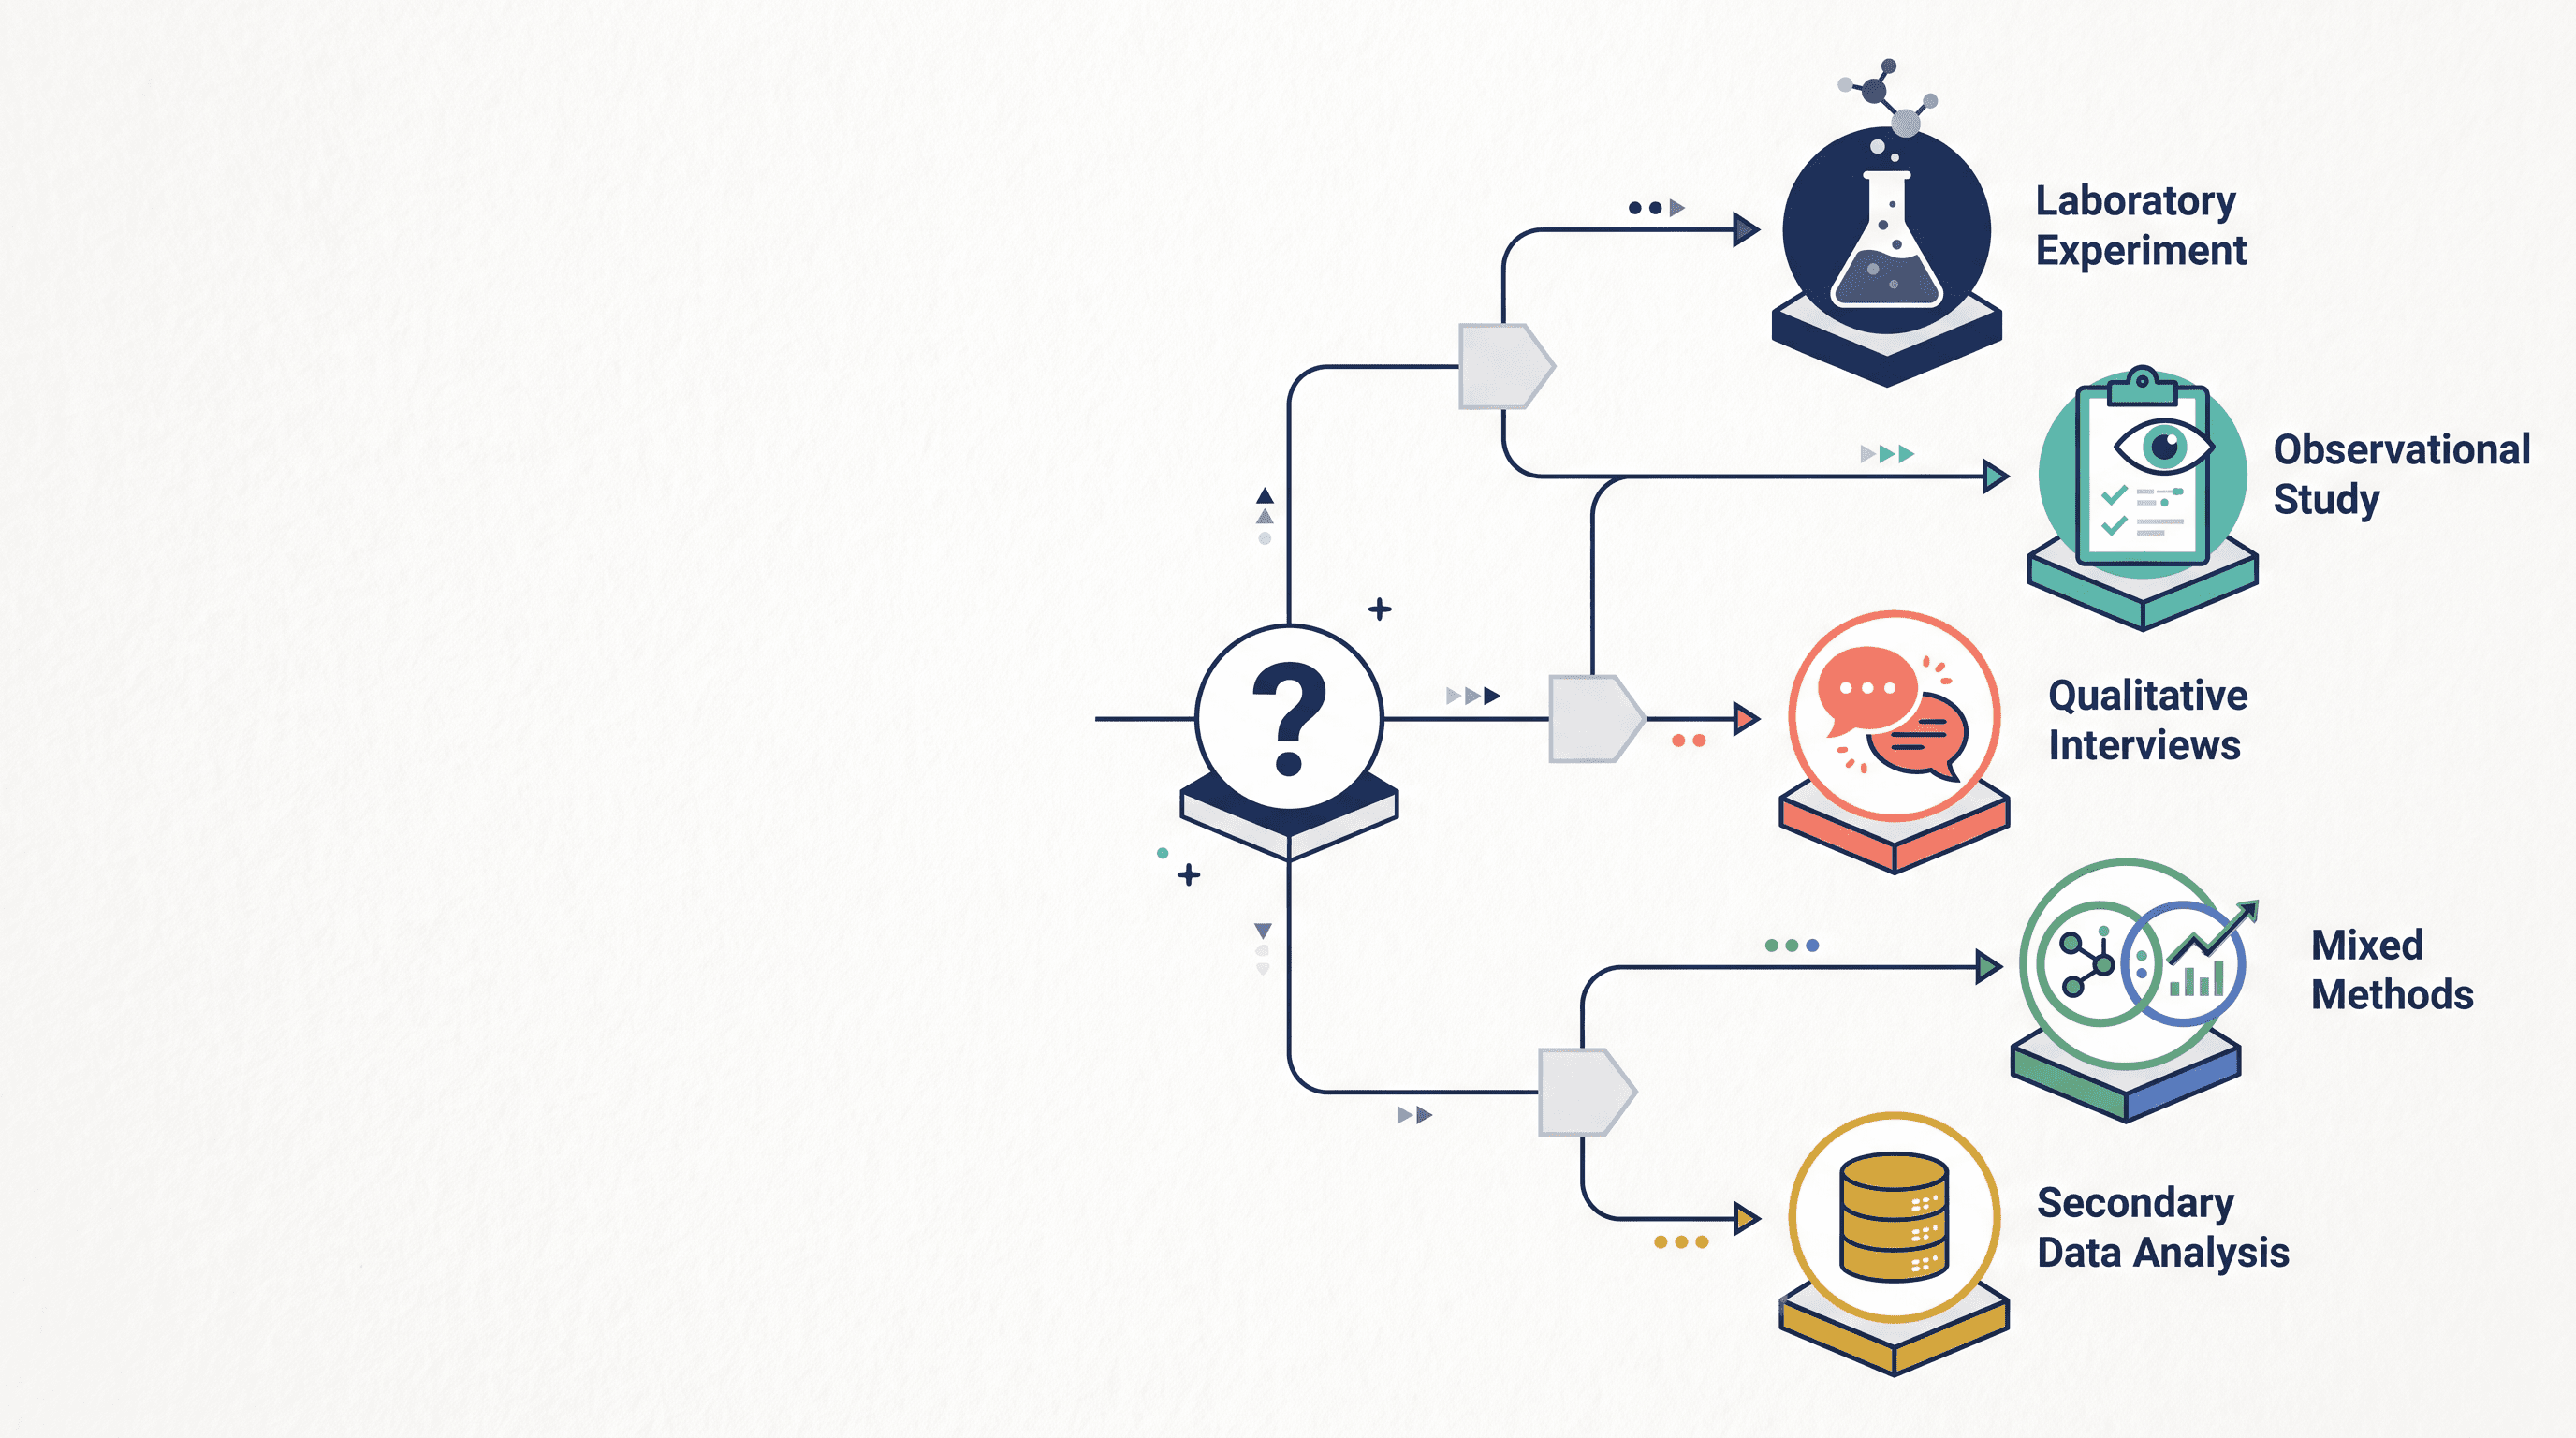
If you are choosing a thesis design, start with the verb in your research question. Test usually points to experimental or quasi-experimental design; associate or predict points to correlational or observational design; explore meaning points to qualitative design; evaluate a program may need mixed methods.
The 25 examples below are not scripts to copy. They are adaptable patterns: each one names the purpose, variables or concepts, data-collection method, analysis method, and the limitation you must acknowledge before your adviser does.
How to use these 25 research design examples
A research design is the plan that connects your question to evidence: who or what you will study, what you will measure or observe, when data will be collected, and how comparisons will be made. A research methodology is the broader logic behind that plan, such as quantitative, qualitative, mixed-methods, experimental, or interpretive. A data-collection method is how evidence is gathered: survey, interview, observation, records review, experiment, document analysis. A data-analysis technique is how evidence is examined: regression, ANOVA, thematic analysis, coding, segmented time-series analysis, or another method.
That distinction matters because thesis chapters often blur these terms. A Springer chapter on writing about research design notes that design writing includes variables, research approach, research questions, and data-collection methods, which is a useful minimum checklist for thesis writers (Springer Nature Link).
Use the examples by matching the question first:
Causal questions: “Does X cause Y?” Use experimental or quasi-experimental designs when feasible.
Pattern questions: “Is X related to Y?” Use correlational, observational, or survey designs.
Prediction questions: “Which factors estimate a later outcome?” Use predictive correlational or cohort designs.
Meaning questions: “How do people experience or interpret X?” Use qualitative designs.
Program or practice questions: “Does this intervention work, and how can it improve?” Use evaluation, action research, or mixed methods.
A useful adaptation template looks like this:
Design field | What to specify in your thesis |
|---|---|
Research question | The exact question the design answers |
Unit of analysis | Individual, class, school, clinic, document, event, country, case |
Population | Who or what the findings are about |
Independent / explanatory variable | The intervention, exposure, predictor, group, or condition |
Dependent / outcome variable | The measured result or response |
Controls / confounders | Variables that may distort the relationship |
Sample | Size, sampling method, inclusion and exclusion criteria |
Data collection | Survey, test, interview, observation, records, documents, logs |
Analysis | Statistical model, coding approach, comparison method, integration strategy |
Main limitation | The claim the design cannot support |
For a fuller breakdown of what belongs in a design section, see Otio’s guide to the components of research design. The examples below give you the working parts; your final design still has to fit feasibility, ethics approval, access to participants, measurement quality, and department rules.
Experimental and quasi-experimental research design examples
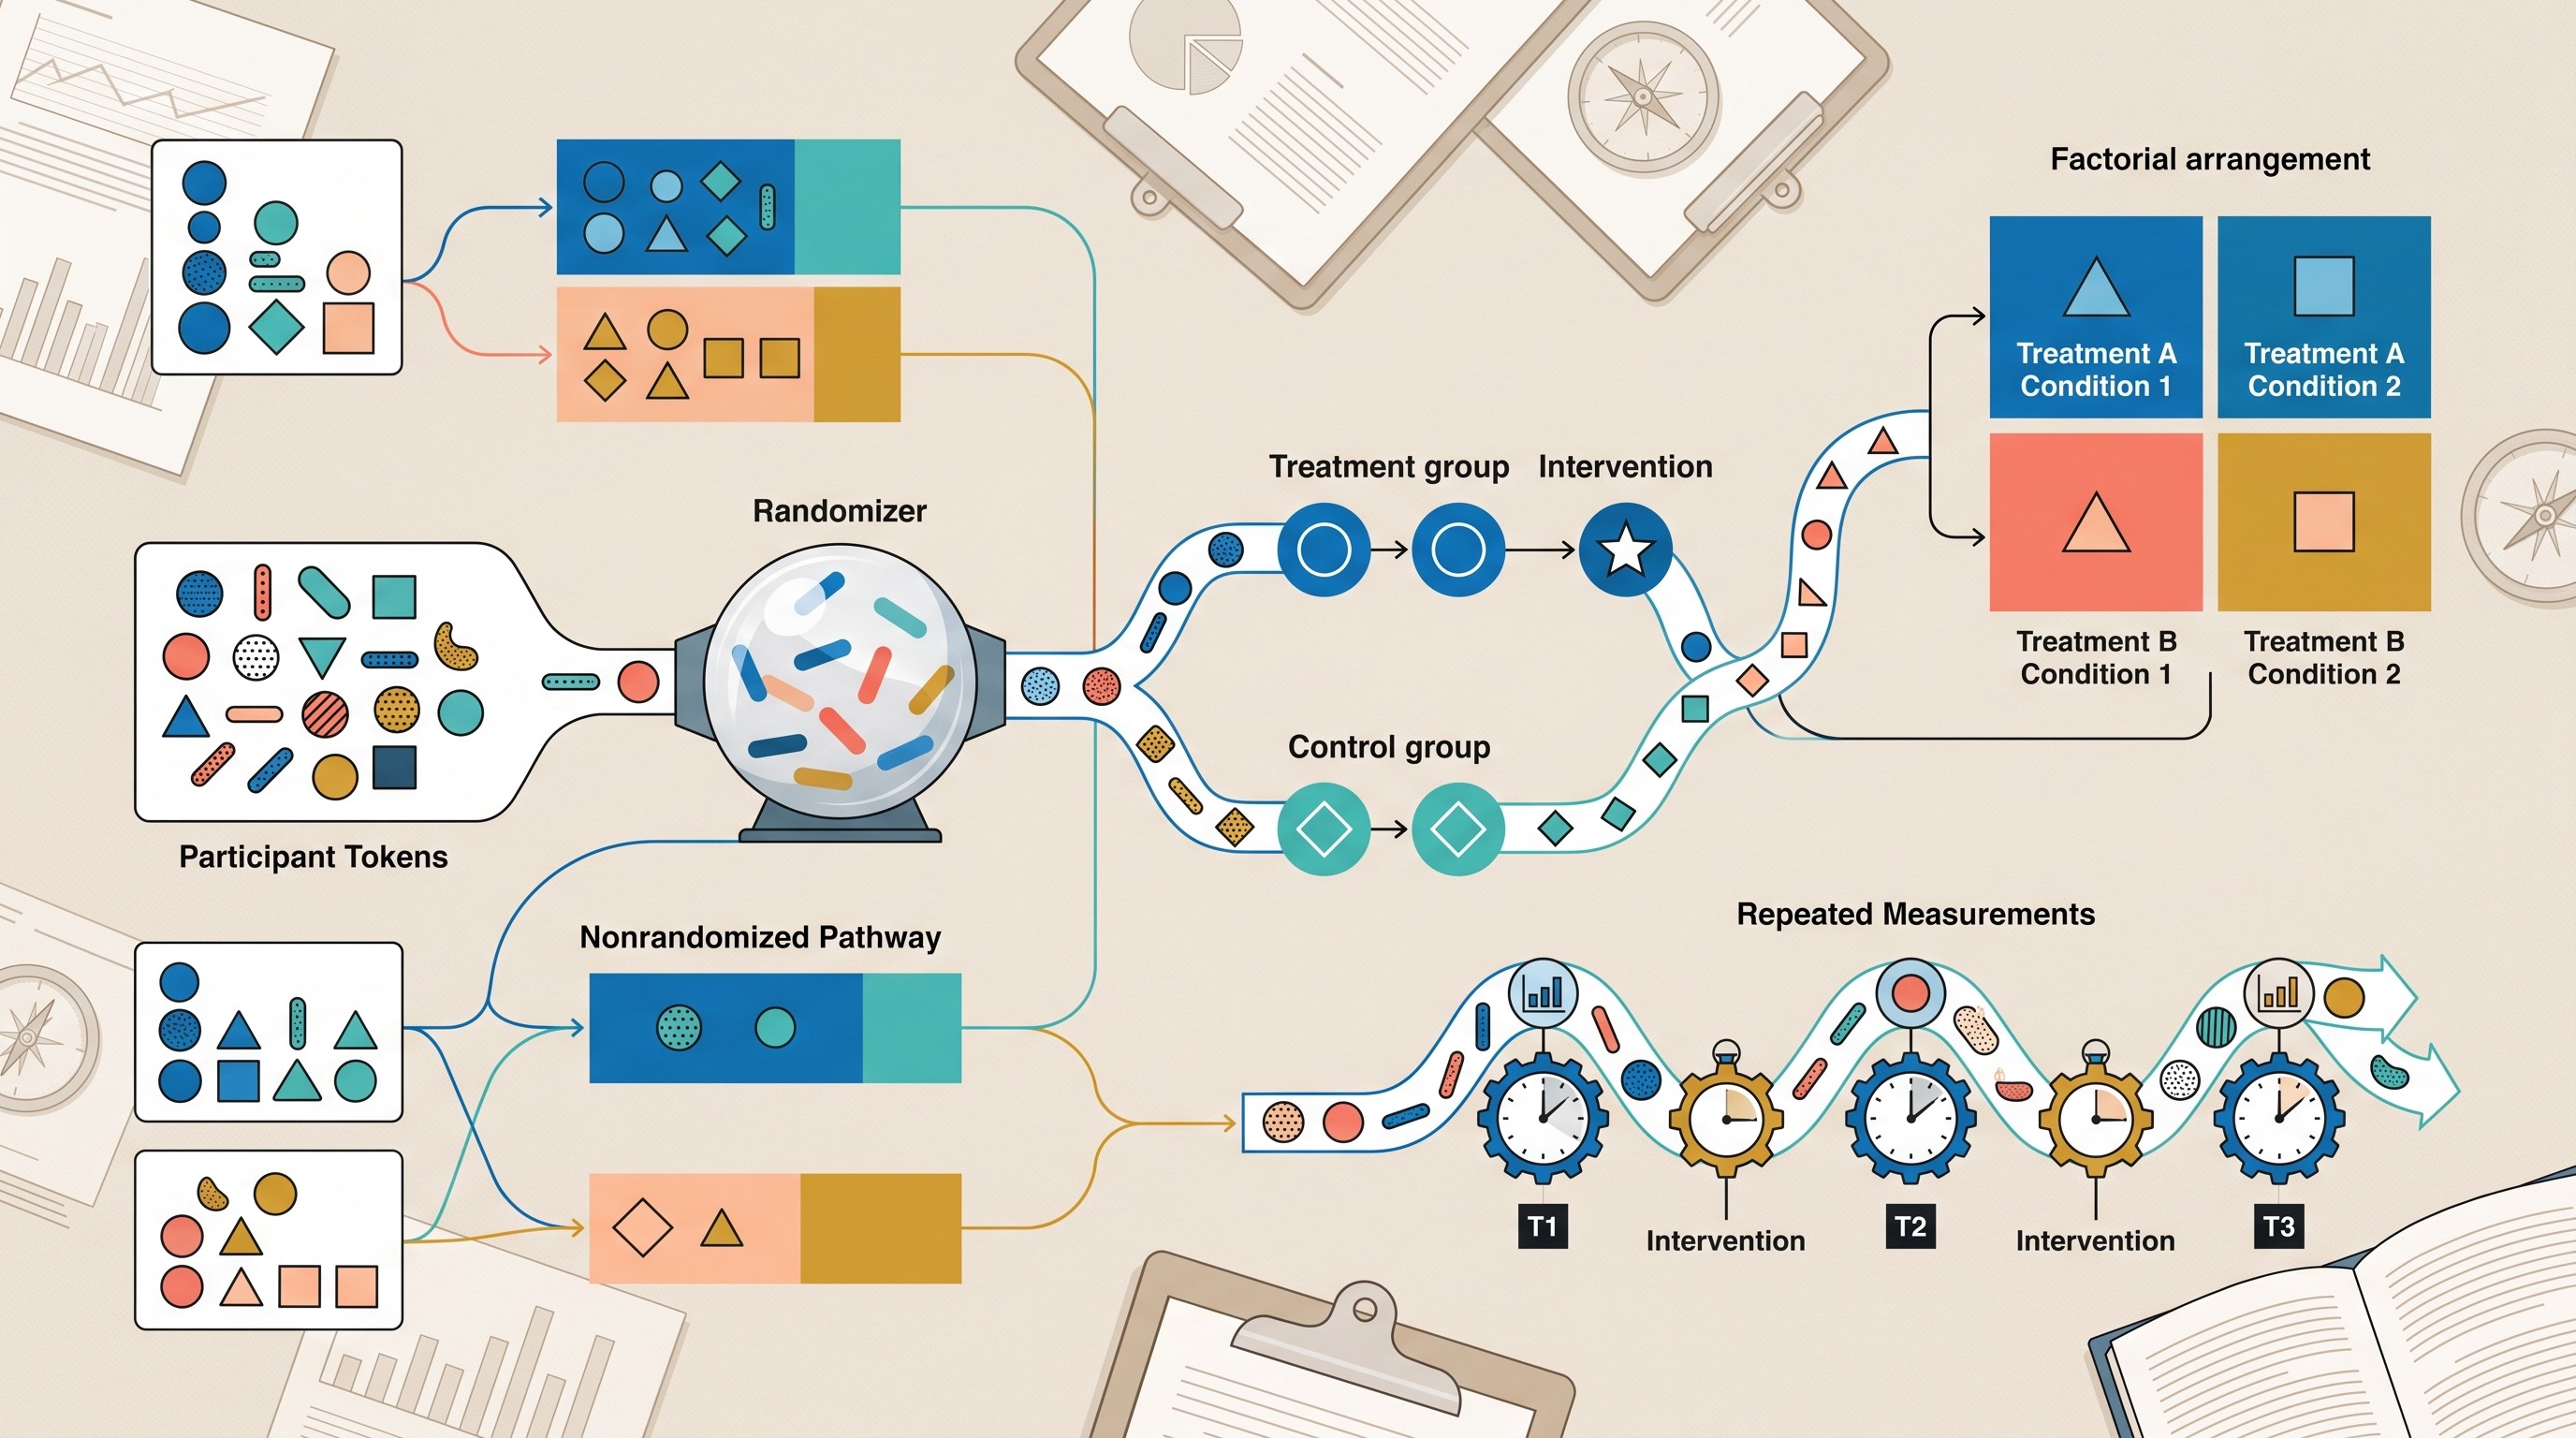
Experimental and quasi-experimental designs are for questions about effects. The difference is assignment. In a true experiment, the researcher assigns participants to conditions, often randomly. In a quasi-experiment, the intervention or group difference exists without random assignment.
1. Randomized controlled trial
Example question: Does a four-week thesis-writing workshop improve proposal scores among master’s students?
Independent variable: Workshop participation, assigned as treatment or control.
Dependent variable: Proposal score on a standardized rubric.
Control variables: Prior GPA, discipline, previous research-methods coursework.
Sample: Eligible master’s students randomly assigned to workshop or usual support.
Data collection: Pretest writing sample, posttest proposal, attendance records.
Analysis: Independent-samples t-test, ANCOVA, or regression with baseline score.
Main limitation: Randomization may be impractical or unethical if students expect equal access to support.
This design is strongest when the thesis claim is causal: “the intervention caused a change.” The design becomes weaker if many participants drop out or if the control group receives a similar intervention elsewhere.
2. Quasi-experimental pretest-posttest control-group design
Example question: Did a new statistics tutoring program improve exam performance compared with a similar department without the program?
Independent variable: Department exposure to the tutoring program.
Dependent variable: Change in statistics exam score.
Key design variables: Group, time, treatment exposure.
Sample: Students in the intervention department and a comparable nonintervention department.
Data collection: Pre-program and post-program exam results.
Analysis: Difference-in-differences, repeated-measures ANOVA, or regression with group-by-time interaction.
Main limitation: Selection bias, because students were not randomly assigned.
This design works when random assignment is impossible but baseline data exist. The thesis should explain why the comparison group is credible and what unmeasured differences may remain.
3. Factorial experimental design
Example question: How do teaching format and feedback frequency affect student performance in a research-methods course?
Independent variables: Teaching format, such as online versus in-person; feedback frequency, such as weekly versus biweekly.
Dependent variable: Final research-methods assessment score.
Possible moderator: Prior statistics experience.
Sample: Students assigned to four combinations of format and feedback frequency.
Data collection: Course assessments, feedback logs, background questionnaire.
Analysis: Factorial ANOVA or regression with interaction terms.
Main limitation: Interaction effects usually need larger samples than simple two-group comparisons.
The payoff is that you can test whether two variables work together. For example, weekly feedback may help online students more than in-person students.
4. One-group pretest-posttest design
Example question: Does a library orientation session improve students’ ability to identify peer-reviewed sources?
Independent variable: Exposure to the orientation session.
Dependent variable: Source-evaluation test score.
Key design variable: Time, measured before and after the session.
Sample: One group of students attending the session.
Data collection: Pretest, posttest, session attendance.
Analysis: Paired-samples t-test or Wilcoxon signed-rank test.
Main limitation: No control group, so improvement may reflect testing effects, maturation, or outside help.
This is often feasible for a pilot thesis. It should be written modestly: “scores improved after the session,” not “the session caused the improvement” unless alternative explanations are addressed.
5. Interrupted time-series design
Example question: Did a new appointment-reminder system reduce monthly missed counseling appointments?
Independent variable: Implementation of the reminder system.
Dependent variable: Monthly no-show rate.
Unit of analysis: Month, clinic, department, or service unit.
Sample: Repeated observations before and after implementation.
Data collection: Administrative records across enough pre- and post-intervention periods.
Analysis: Segmented regression or time-series analysis.
Main limitation: Another event at the intervention point may explain the shift.
Interrupted time-series designs are useful when you have routine records. The design is much stronger with many observations before and after the intervention, not just one before-and-after comparison.
Correlational and observational research design examples
Correlational and observational designs examine naturally occurring variables. They can show association, prediction, sequence, or group differences, but they do not automatically prove causation.
If you are working in this family of designs, Otio’s guide to correlational research design is a useful companion.
6. Cross-sectional correlational study
Example question: Is weekly study time associated with thesis-writing confidence among postgraduate students?
Explanatory variable: Self-reported weekly study time.
Outcome variable: Thesis-writing confidence score.
Control variables: Degree level, employment status, prior research experience.
Sample: Postgraduate students surveyed once.
Data collection: Online questionnaire.
Analysis: Correlation, partial correlation, or multiple regression.
Main limitation: One-time measurement cannot establish temporal order.
This design is appropriate for “related to” questions. Avoid causal wording such as “study time increases confidence” unless the design supports that claim.
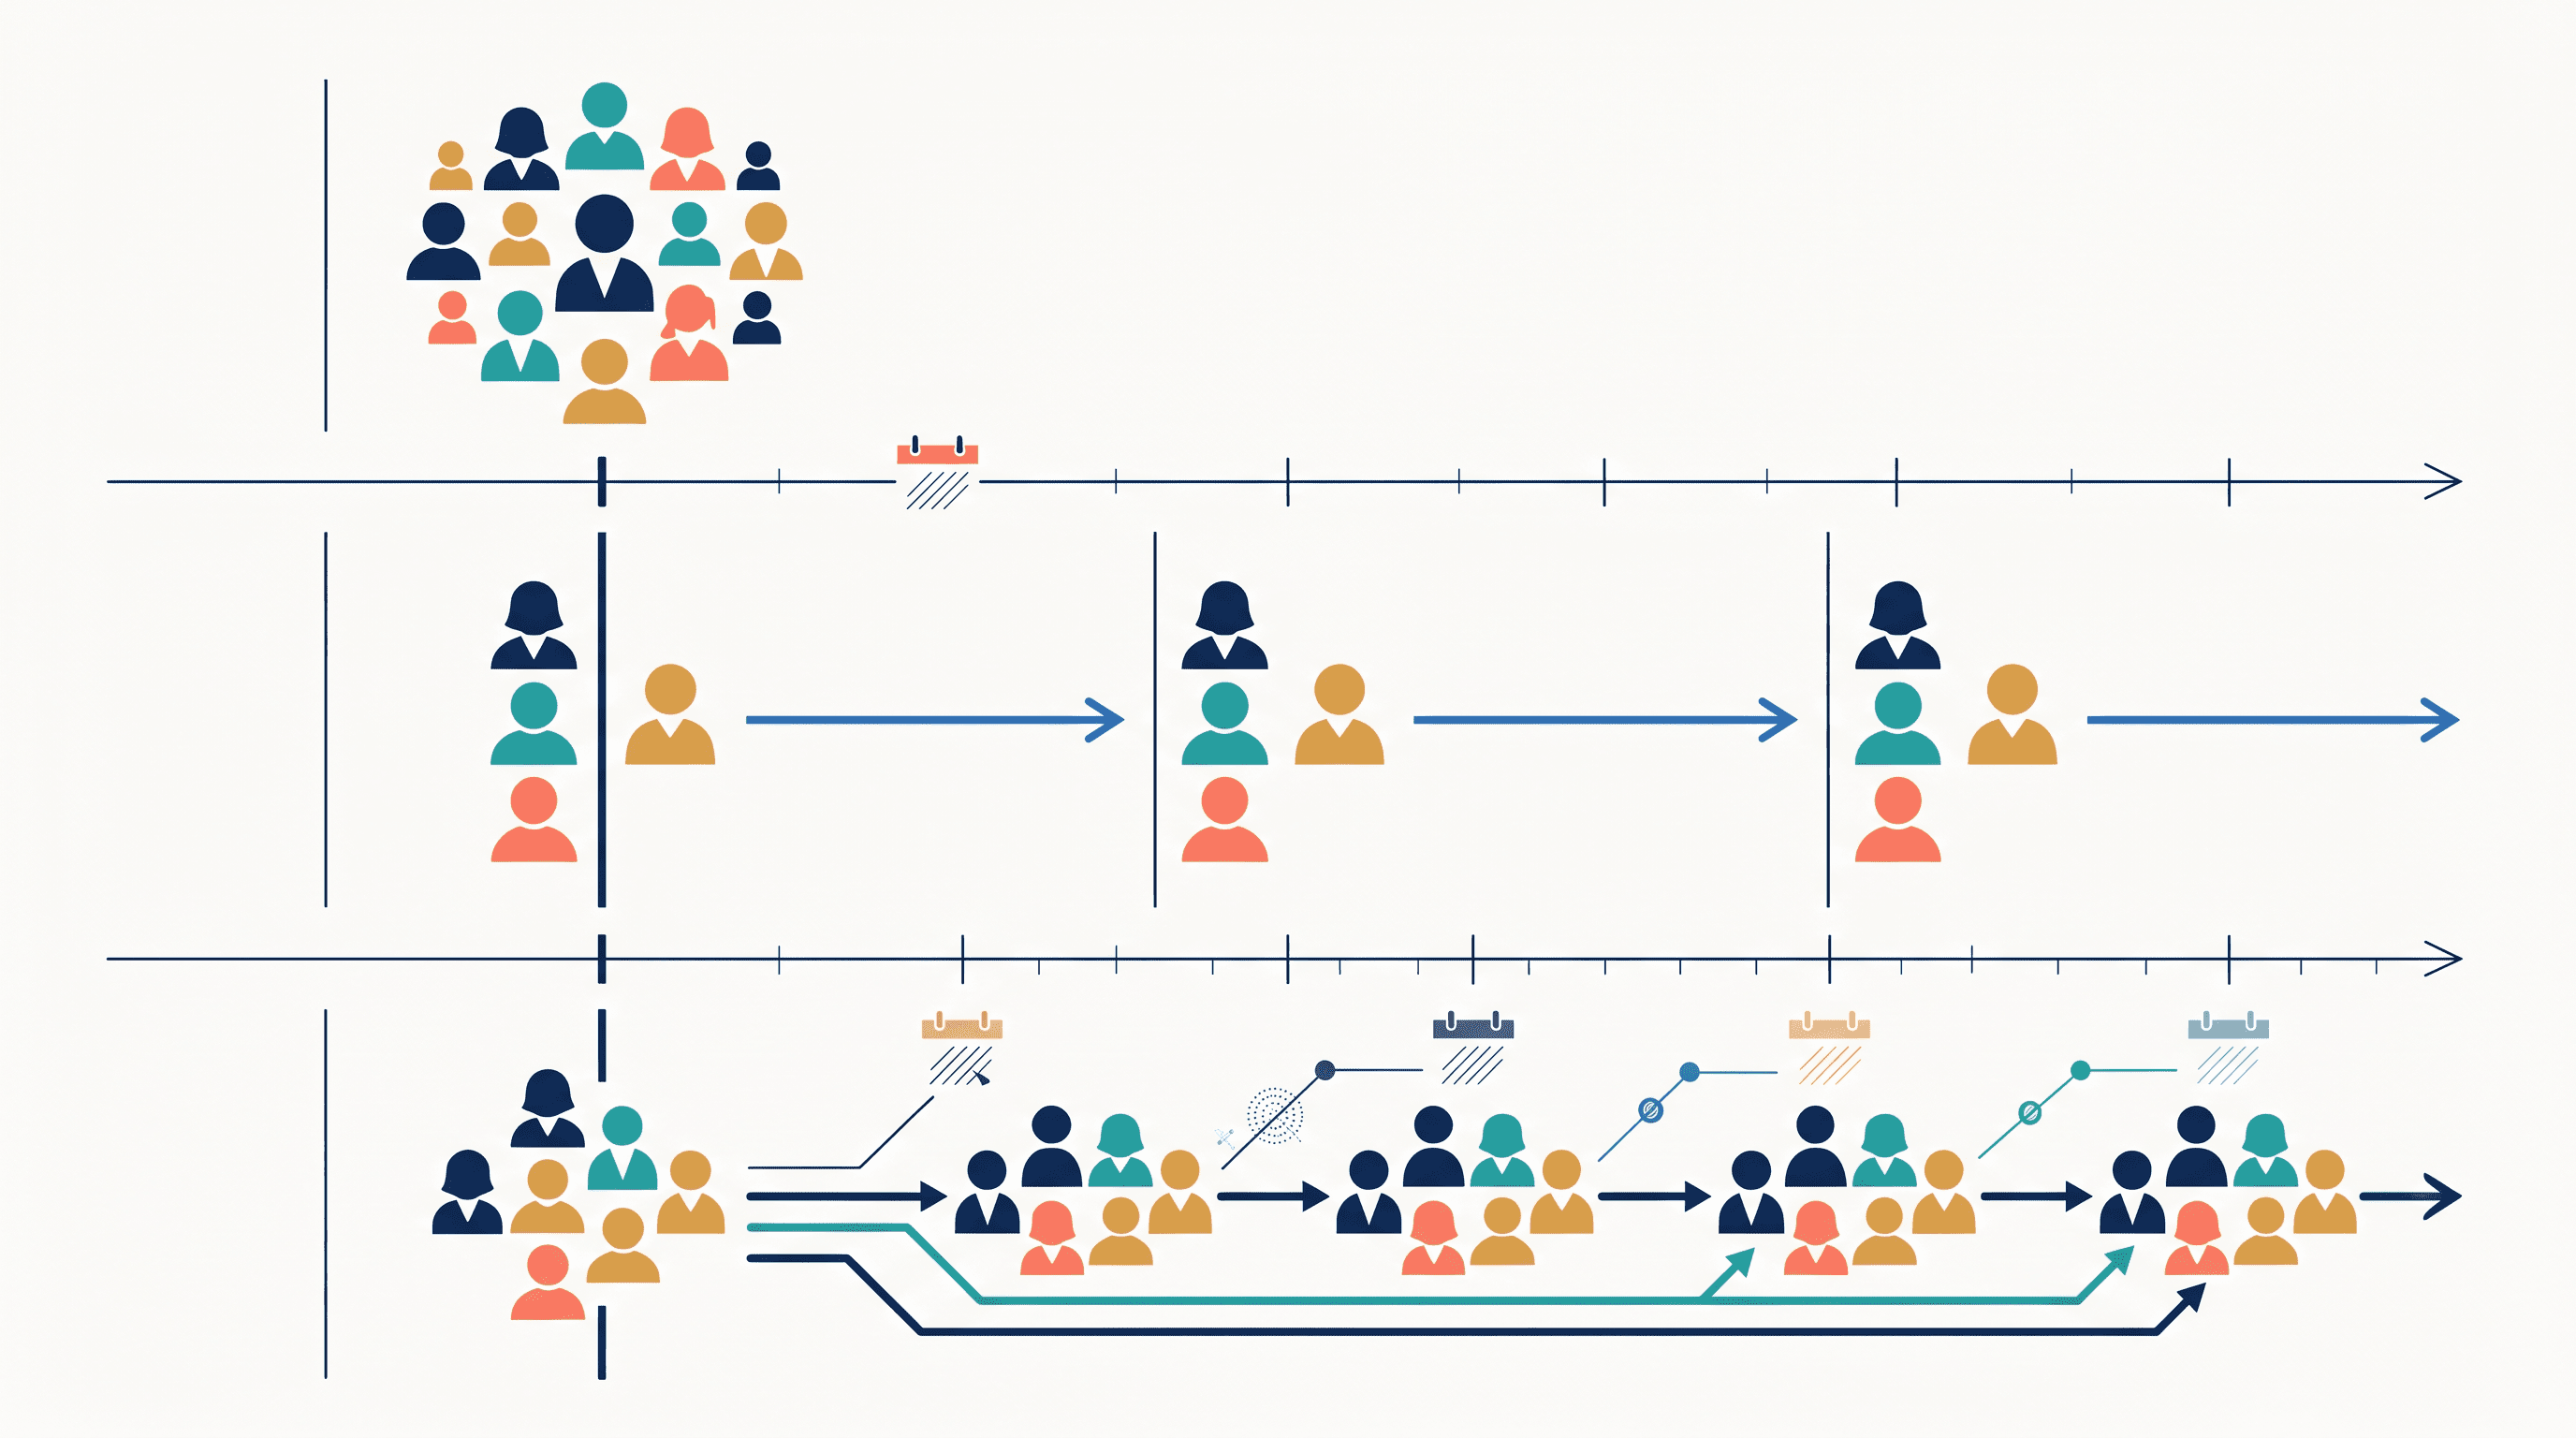
7. Longitudinal panel study
Example question: How do research self-efficacy and writing progress change together across a semester?
Explanatory variable: Research self-efficacy measured at multiple points.
Outcome variable: Writing progress, such as pages completed or milestones reached.
Unit of analysis: Individual student over time.
Sample: Same students followed across three or more waves.
Data collection: Repeated surveys, progress logs, adviser milestone records.
Analysis: Growth-curve modeling, mixed-effects models, or repeated-measures analysis.
Main limitation: Attrition and missing data can bias results.
A panel design is better than a cross-sectional design when change matters. The same people are measured repeatedly, which lets you examine within-person change.
8. Predictive correlational design
Example question: Which factors predict thesis completion time?
Predictor variables: Supervisor feedback frequency, planning behavior, prior writing experience, work hours.
Outcome variable: Time to thesis completion.
Control variables: Program type, discipline, enrollment status.
Sample: Students whose thesis completion status can be tracked.
Data collection: Survey plus institutional completion records.
Analysis: Multiple regression, survival analysis, or another prespecified predictive model.
Main limitation: Prediction is not the same as causal explanation.
This design is useful when the thesis goal is estimation: identifying variables that forecast an outcome. It should include a clear plan for handling overfitting if the sample is small relative to the number of predictors.
9. Causal-comparative or ex post facto design
Example question: Do students with prior research-methods training differ in proposal quality from students without such training?
Grouping variable: Prior research-methods training, yes or no.
Outcome variable: Proposal quality score.
Control variables: Academic level, discipline, GPA, adviser experience.
Sample: Existing groups of students.
Data collection: Training history and proposal evaluations.
Analysis: t-test, ANCOVA, regression, or matched comparison.
Main limitation: Preexisting group differences weaken causal conclusions.
This design compares groups after the fact. It can support careful language about differences, not strong claims that the prior training caused the difference. For more detail, see Otio’s guide to causal-comparative research designs.
10. Cohort study
Example question: Are students who join a structured writing program more likely to submit their thesis on time?
Exposure variable: Participation in the writing program.
Outcome variable: On-time thesis submission.
Follow-up period: One semester or academic year.
Covariates: Prior progress, employment status, degree program, supervisor meeting frequency.
Sample: A defined cohort of students followed from proposal approval.
Data collection: Program records, institutional submission data, baseline survey.
Analysis: Risk ratios, logistic regression, survival analysis.
Main limitation: Exposure is not randomly assigned, so motivated students may be more likely to participate.
Cohort studies can be prospective, with data collected going forward, or retrospective, using existing records. University of New Hampshire’s research design guide lists cohort designs among common study designs and points to methodological sources on cohort analysis (UNH Library).
Descriptive, survey, and measurement research design examples
These designs are useful when the thesis goal is to describe a population, compare groups, track attitudes, analyze existing data, or develop a measurement instrument.
11. Descriptive cross-sectional survey
Example question: What proportion of postgraduate students have access to statistical support?
Variables: Access to statistical support, type of support, frequency of use, perceived adequacy.
Population: Postgraduate students in a university or faculty.
Sample: Stratified or convenience sample, depending on access.
Data collection: Survey questionnaire.
Analysis: Frequencies, percentages, means, confidence intervals.
Main limitation: Sampling and nonresponse affect generalizability.
This design does not test an intervention or causal relationship. Its quality depends heavily on sampling and clear measurement.
12. Comparative survey design
Example question: Do thesis-writing anxiety levels differ by discipline and year of study?
Grouping variables: Discipline, year of study.
Outcome variable: Thesis-writing anxiety score.
Control variables: Prior thesis experience, enrollment status, adviser meeting frequency.
Sample: Students across several disciplines and academic years.
Data collection: Standardized anxiety or research-confidence questionnaire.
Analysis: ANOVA, chi-square tests, or regression with group indicators.
Main limitation: Group comparisons may reflect unmeasured differences beyond discipline or year.
This design works when groups are already defined and the goal is comparison. It should report whether the sampling approach supports claims about the wider student population.
13. Repeated cross-sectional survey
Example question: How have postgraduate students’ attitudes toward generative AI in research changed over three semesters?
Key variable: Attitude toward generative AI use.
Time variable: Semester or survey wave.
Population: Same population at each time point.
Sample: Different samples drawn from that population at each wave.
Data collection: Repeated survey with consistent core measures.
Analysis: Trend analysis, regression with time indicators.
Main limitation: Changes may reflect differences between samples, not changes within the same individuals.
Unlike a panel study, this design does not follow the same people. It estimates population-level change.
14. Secondary-data analysis
Example question: What institutional factors are associated with delayed thesis submission using existing university records?
Outcome variable: Delayed submission, measured from institutional deadlines.
Explanatory variables: Program, enrollment mode, leave history, milestone completion dates.
Inclusion criteria: Students admitted within a defined period.
Data source: Institutional records, public datasets, established surveys, or administrative logs.
Analysis: Descriptive statistics, regression, survival analysis, subgroup analysis.
Main limitation: Existing variables may not match the ideal constructs.
Secondary-data analysis is efficient, but it is not automatically easy. You need rules for missing data, duplicate records, variable definitions, and permissions. IntechOpen’s overview of research design and methodology highlights the need to specify data sources, population, sample size, and data-collection methods in a research design chapter (IntechOpen).
15. Instrument development and validation study
Example question: Can a reliable and valid scale be developed to measure thesis-writing self-efficacy?
Construct: Thesis-writing self-efficacy.
Item pool: Statements based on literature, interviews, or existing theory.
Participants: Students similar to the intended users of the instrument.
Data collection: Expert review, pilot survey, revised survey.
Analysis: Item analysis, reliability coefficients, exploratory or confirmatory factor analysis.
Main limitation: Reliability alone does not prove validity.
A good validation study explains evidence for content, structure, and intended use. Do not claim that a questionnaire is “validated” only because Cronbach’s alpha is high.
[[OTIO_INLINE_PROMO:%7B%22title%22%3A%22Need%20to%20compare%20instruments%20before%20choosing%20one%3F%22%2C%22description%22%3A%22Add%20methodology%20PDFs%20and%20instrument%20papers%20to%20Otio%2C%20ask%20about%20validity%20and%20fit%2C%20then%20save%20the%20evidence%20beside%20your%20survey%20or%20measurement%20notes.%22%7D]]
Qualitative research design examples
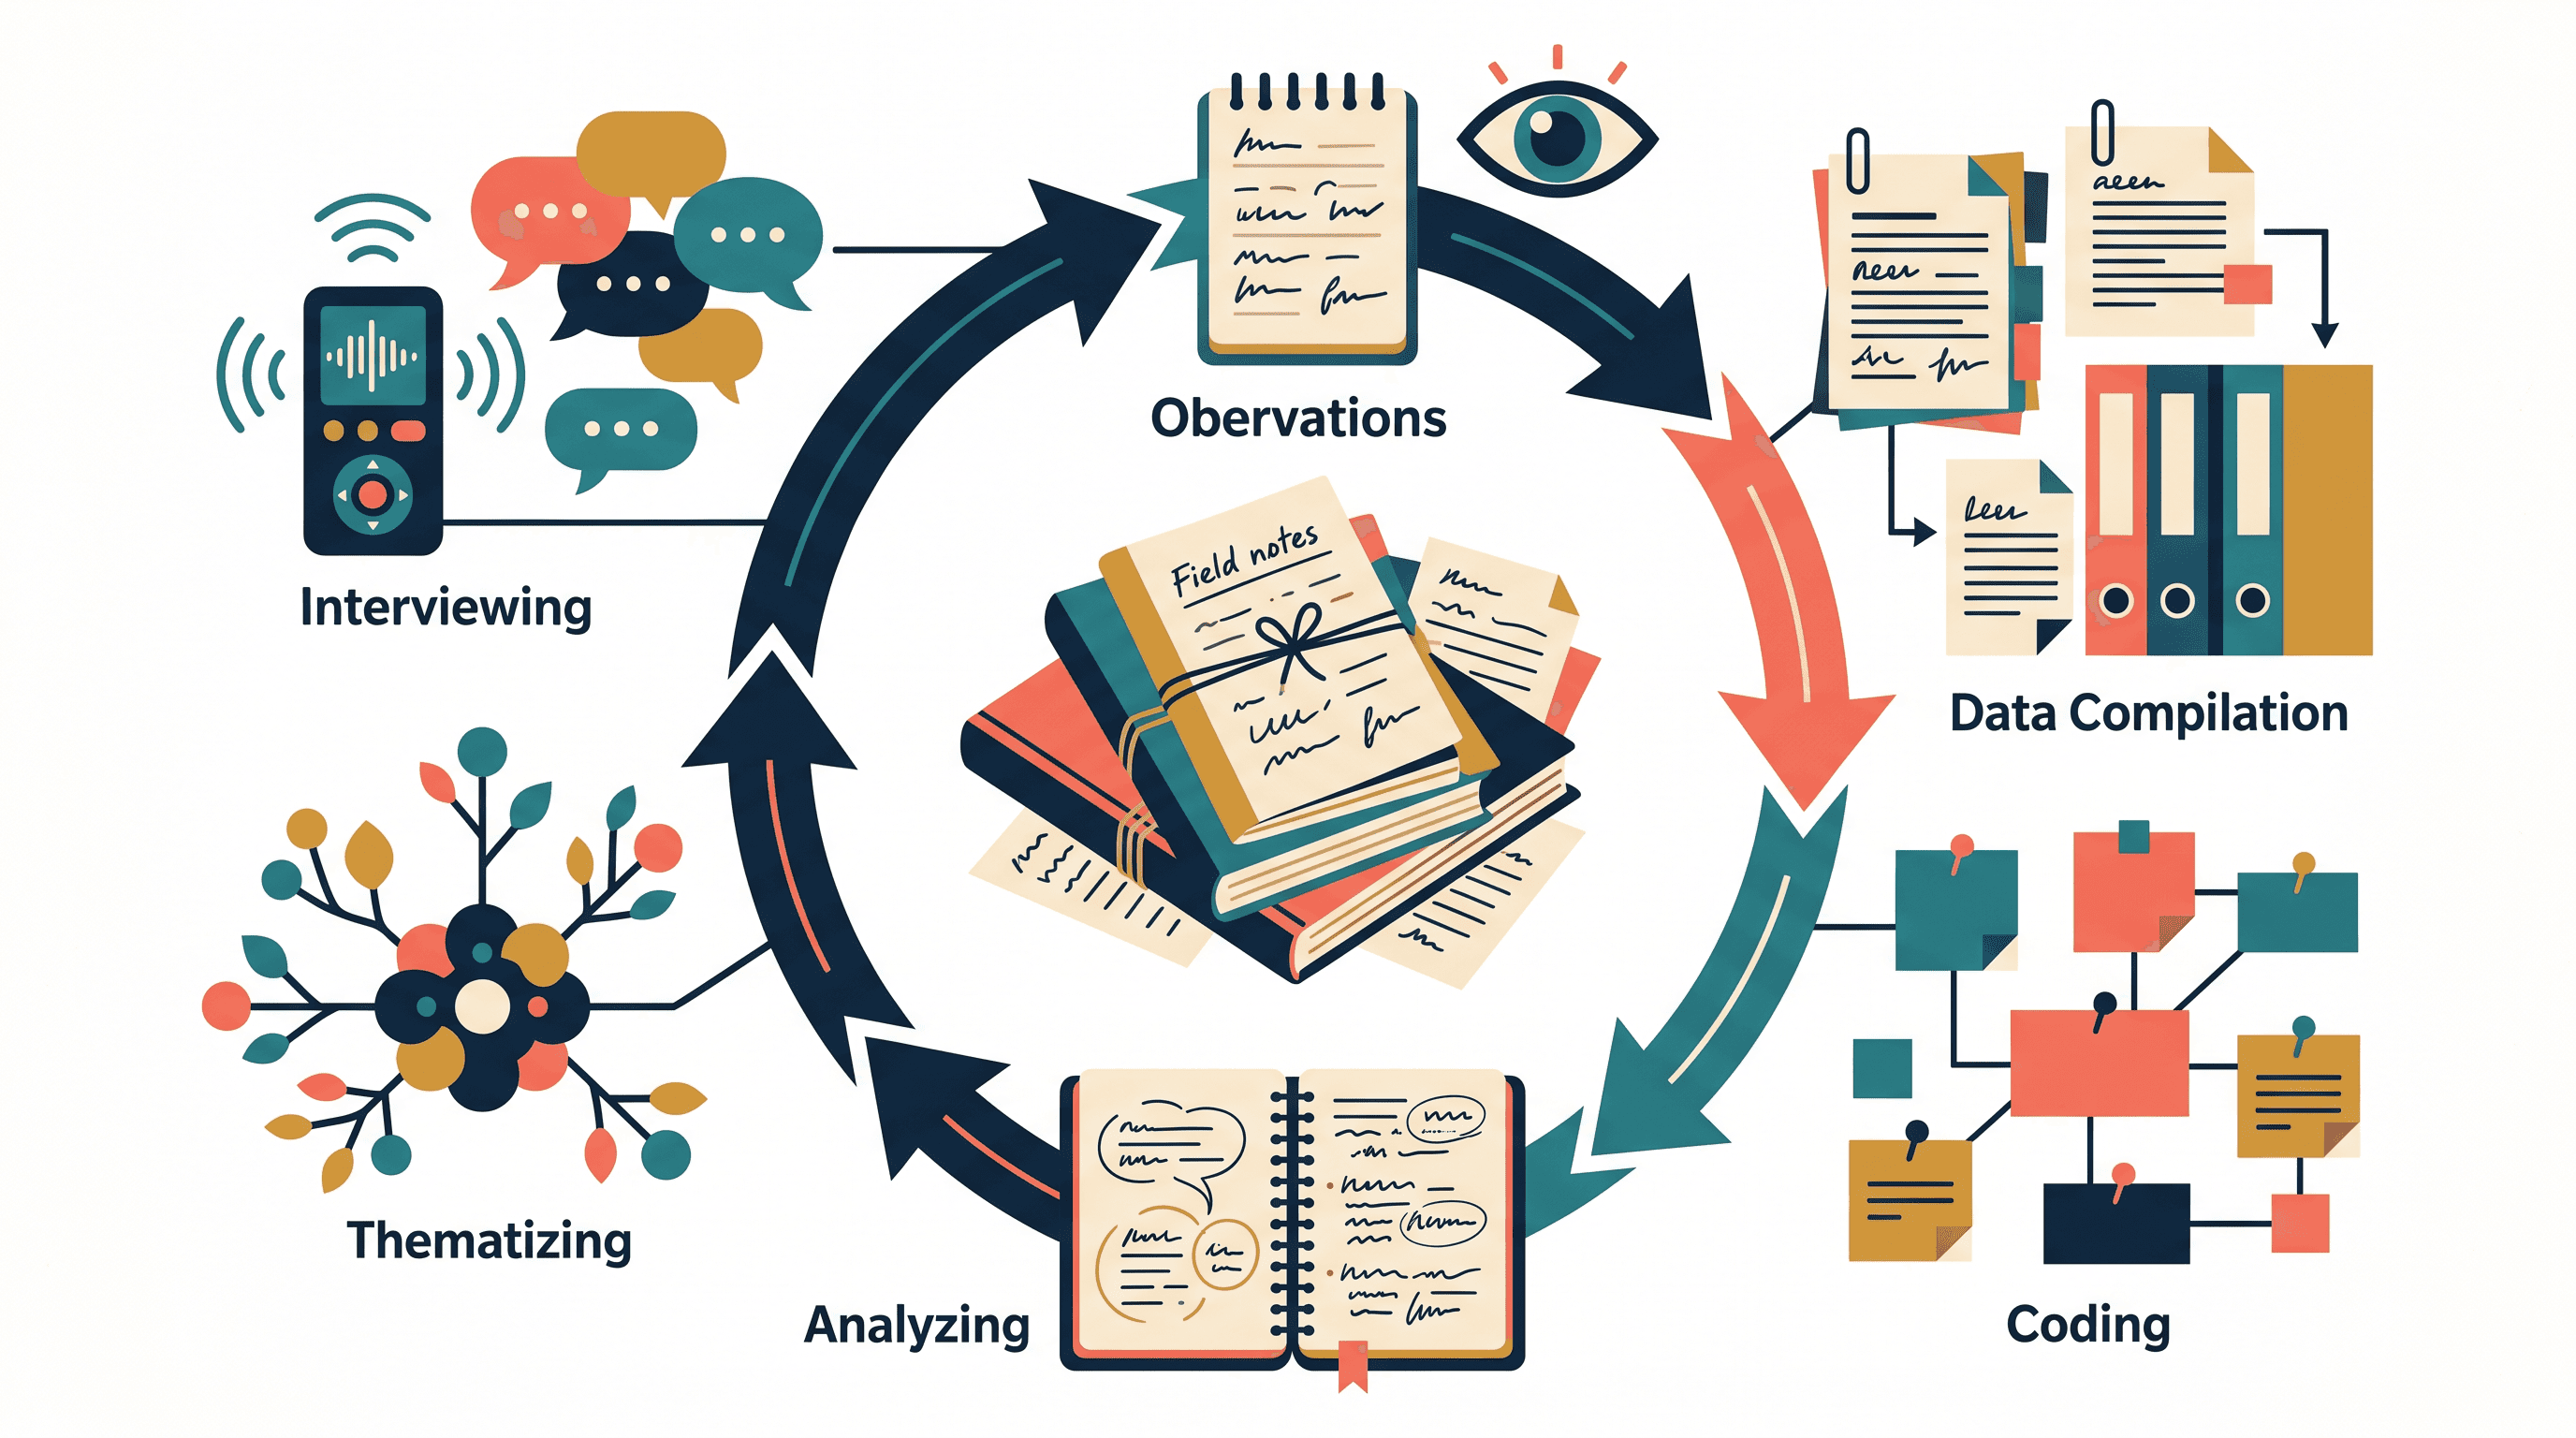
Qualitative designs are built for depth, interpretation, process, context, and meaning. They usually analyze non-numerical data such as interview transcripts, field notes, documents, images, audio, or video. Scribbr’s qualitative research overview defines qualitative research as collecting and analyzing non-numerical data to understand concepts, opinions, or experiences (Scribbr).
For more detail on this family of designs, see Otio’s guide to qualitative research design.
16. Case study
Example question: How does one university’s thesis-support program operate, and how do students experience it?
Case: A bounded program, department, school, clinic, platform, or community.
Unit of analysis: The program as a whole, or participants within the program.
Data sources: Interviews, documents, observations, usage records.
Sample: Participants and documents selected because they illuminate the case.
Analysis: Coding, pattern matching, triangulation across evidence sources.
Main limitation: Contextual depth does not equal statistical generalizability.
A case study must define its boundaries. “A university” is too broad; “the thesis-support program for first-year master’s students in one faculty during one academic year” is more defensible.
17. Phenomenological study
Example question: How do doctoral candidates experience uncertainty during the thesis proposal stage?
Phenomenon: Lived experience of uncertainty during proposal development.
Participants: People who have directly experienced the phenomenon.
Data collection: In-depth interviews, reflective journals, written narratives.
Analysis: Thematic or phenomenological analysis focused on meaning and essence.
Main limitation: Requires careful reflexivity; it should not become a simple opinion survey.
This design is appropriate when the experience itself is the subject. The researcher must bracket, disclose, or otherwise account for assumptions that may shape interpretation.
18. Grounded theory study
Example question: How do novice researchers learn to narrow a broad topic into a feasible thesis question?
Process of interest: Topic narrowing.
Participants: Students, advisers, writing-center staff, or others involved in the process.
Data collection: Iterative interviews, memos, documents, possibly observations.
Analysis: Coding, constant comparison, theoretical sampling.
Output: A conceptual model or theory of the process.
Main limitation: Not suitable if the goal is to test a predetermined causal model.
Grounded theory is not just “interviews plus themes.” Its defining feature is iterative theory development from data.
19. Ethnographic study
Example question: What norms and practices shape feedback in a graduate writing group?
Culture-sharing group: Lab, writing group, studio, clinical team, seminar cohort.
Data sources: Sustained observation, field notes, interviews, artifacts.
Researcher role: Observer, participant-observer, or another defined position.
Analysis: Coding of practices, language, interactions, rituals, and norms.
Main limitation: Access, time, privacy, and researcher position are major constraints.
Ethnography is strongest when the thesis question is about everyday practices and shared meanings. It is weak when the researcher only conducts a few interviews and calls the result ethnography.
20. Narrative inquiry
Example question: How does a doctoral candidate describe the development of their research identity over time?
Focus: Story, chronology, turning points, identity, meaning.
Participants: One or more individuals with rich experience of the topic.
Data collection: Life-history interviews, journals, autobiographical documents, correspondence.
Analysis: Narrative structure, chronology, context, plot, voice, meaning.
Main limitation: One narrative should not be treated as representative of a whole population.
Narrative inquiry is useful when time and personal meaning are central. The unit of analysis is the story, not merely a set of responses.
Mixed-methods and applied research design examples
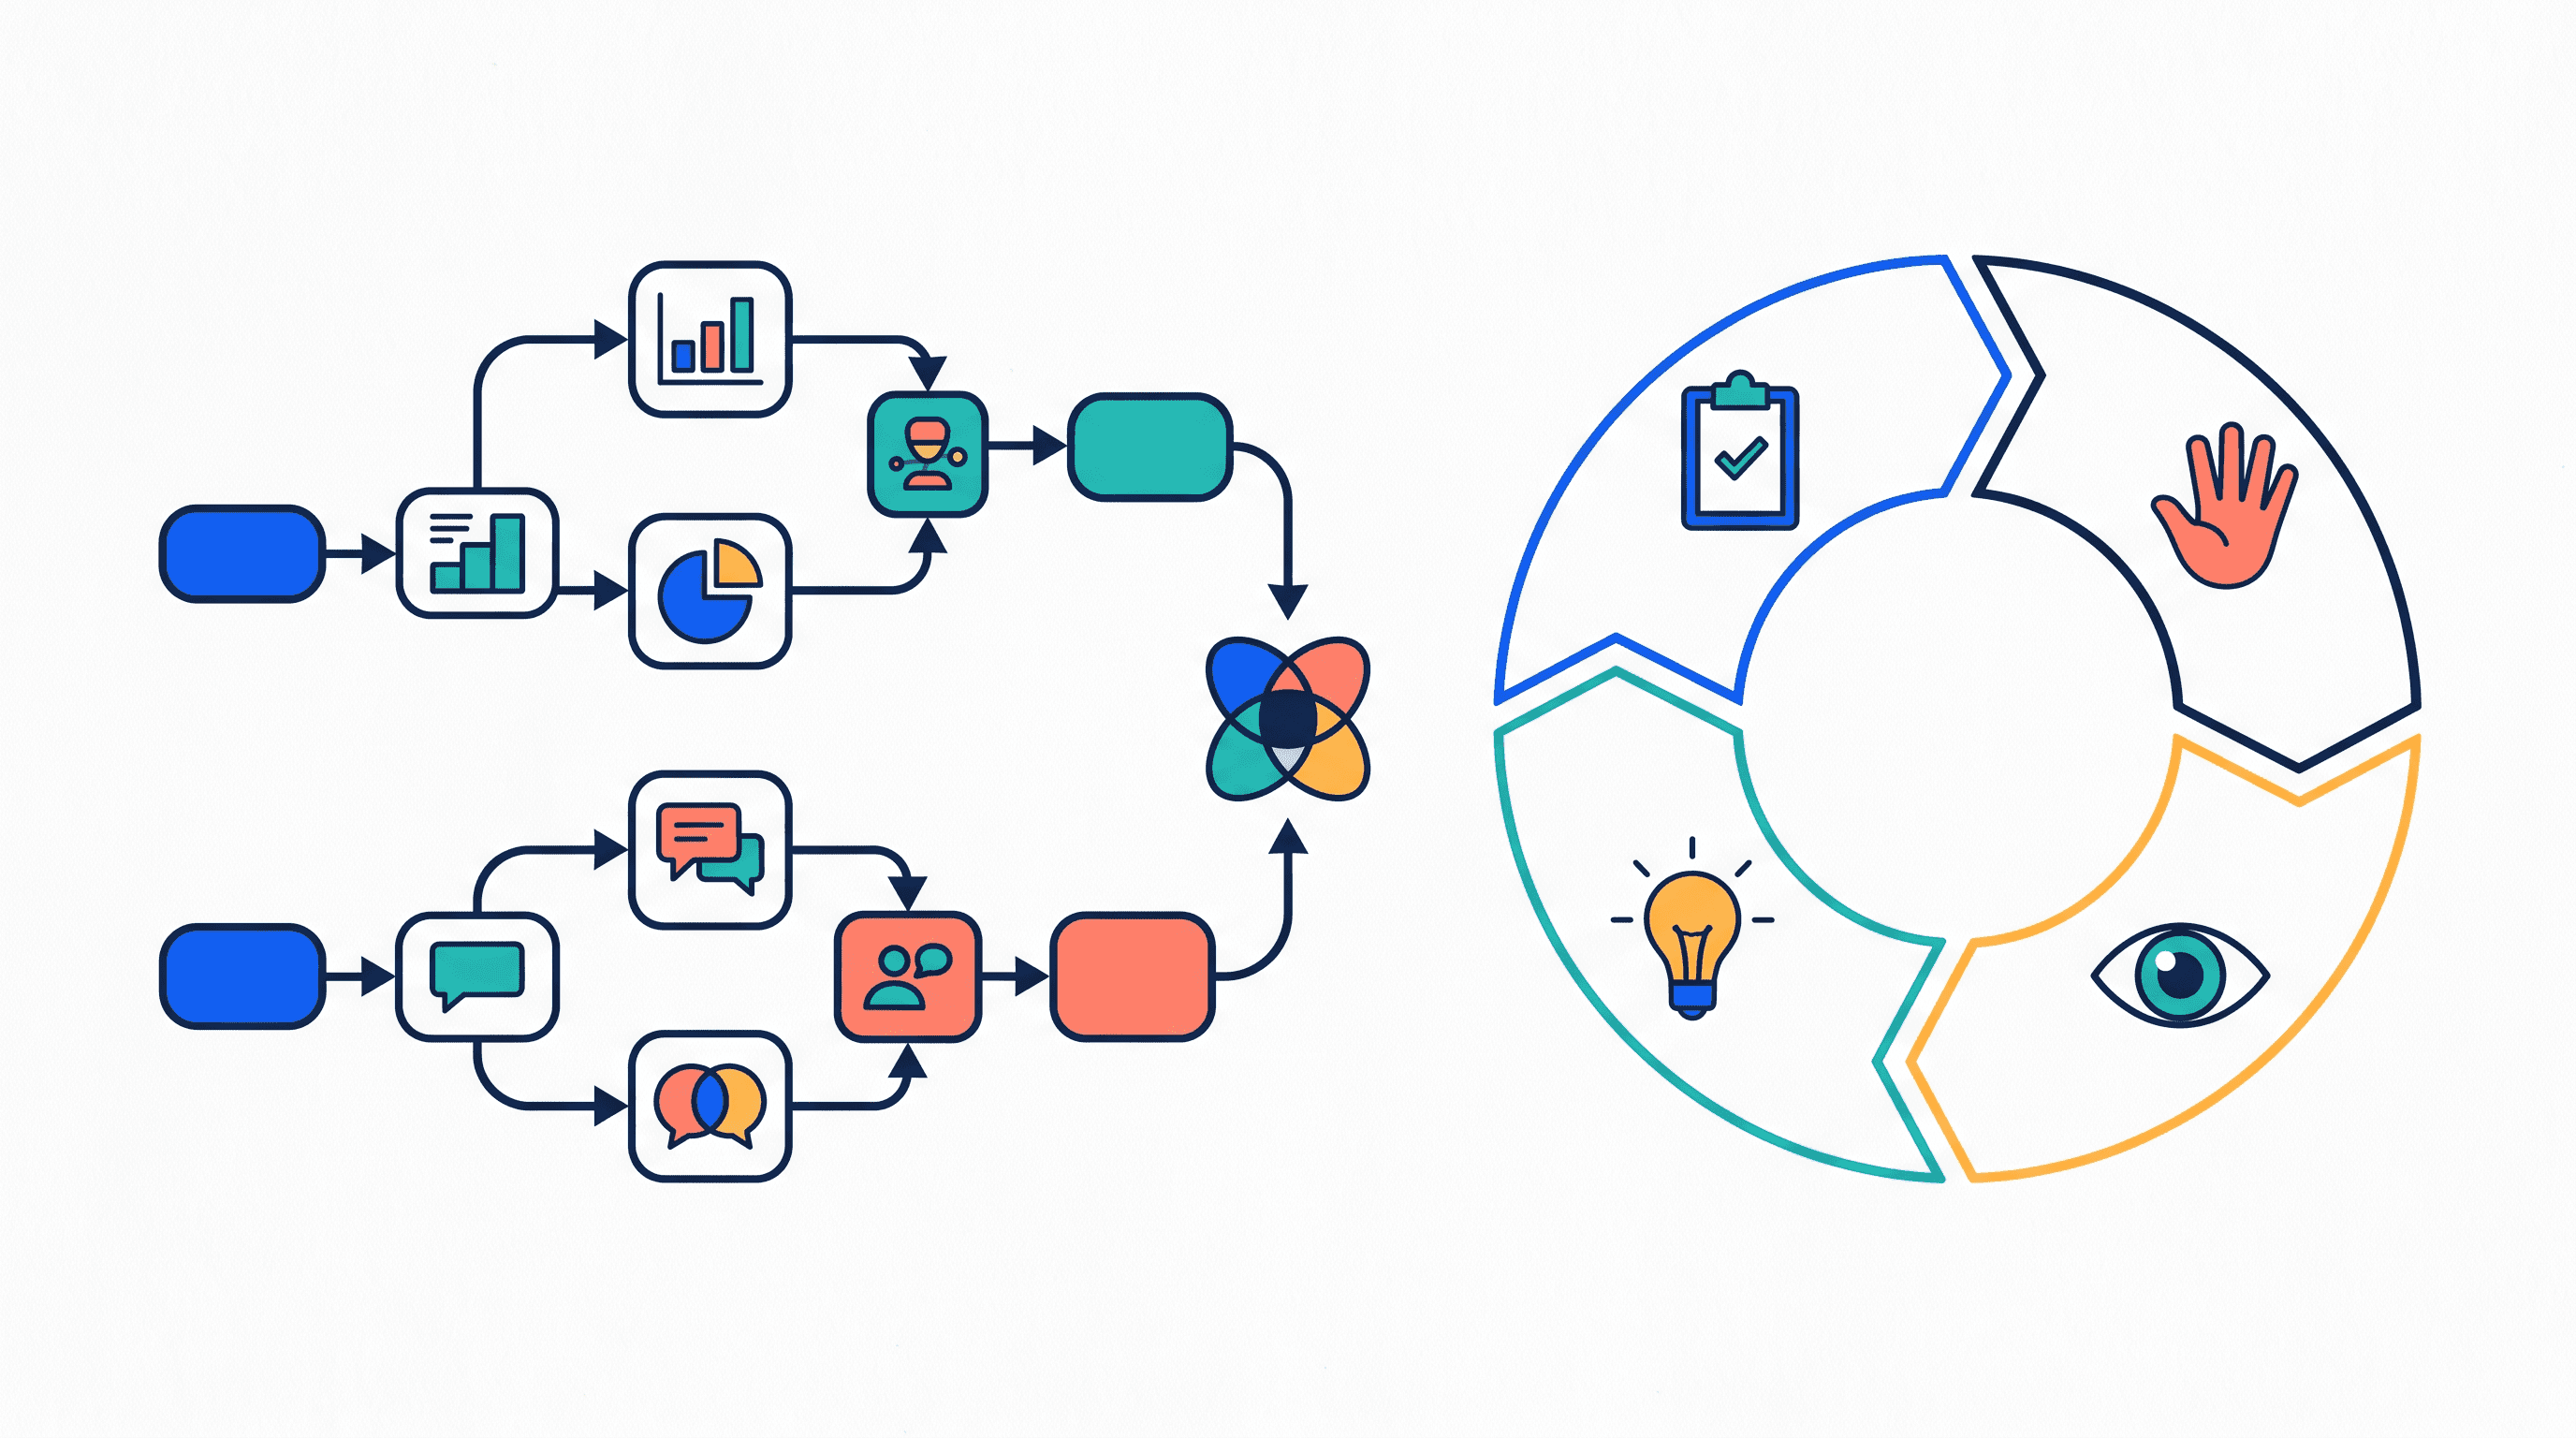
Mixed-methods designs combine quantitative and qualitative strands. Applied designs such as action research and program evaluation may use both forms of evidence, but their purpose is often improvement or assessment rather than theory testing alone.
21. Convergent parallel mixed-methods design
Example question: What is the level of research anxiety among graduate students, and how do students explain its causes?
Quantitative strand: Survey measuring research anxiety.
Qualitative strand: Interviews about sources of anxiety.
Timing: Both strands collected during the same phase.
Integration: Compare statistical patterns with interview themes.
Analysis: Descriptive statistics or regression plus thematic analysis.
Main limitation: Conflicting findings require an integration plan, not selective reporting.
This design works when numbers and explanations are both needed. For example, the survey may show anxiety is highest among part-time students, while interviews explain how scheduling, isolation, and adviser access contribute.
22. Explanatory sequential mixed-methods design
Example question: Why do online students report lower thesis-writing confidence than on-campus students?
Phase 1: Quantitative survey comparing confidence by enrollment mode.
Phase 2: Qualitative interviews with selected students to explain the pattern.
Sampling: Interview participants chosen based on survey results.
Analysis: Regression or group comparison, followed by thematic analysis.
Integration: Use qualitative findings to interpret the quantitative pattern.
Main limitation: Interviews help explain results but do not automatically prove the statistical explanation.
This design is useful when the first phase produces a result that needs interpretation. It is especially helpful for unexpected or puzzling findings.
23. Exploratory sequential mixed-methods design
Example question: What dimensions of “advisor support” matter to thesis students, and how common are they across programs?
Phase 1: Interviews or focus groups to identify dimensions of support.
Phase 2: Survey development and larger-scale measurement.
Variables: Support dimensions discovered in the qualitative phase.
Analysis: Thematic analysis, item development, pilot testing, descriptive or factor analysis.
Main limitation: The transition from themes to survey items must be documented carefully.
This design is useful when existing instruments do not fit the population or context. The qualitative phase helps define what should be measured.
24. Action research
Example question: How can a department improve the quality and timeliness of thesis feedback?
Intervention: Revised feedback process, rubric, meeting schedule, or peer-review cycle.
Participants: Students, supervisors, coordinators, or writing-support staff.
Data collection: Feedback turnaround records, reflections, meeting notes, interviews, artifacts.
Analysis: Cycle-by-cycle comparison, thematic analysis, descriptive indicators.
Main limitation: Context-specific improvement is prioritized over broad generalization.
Action research usually follows cycles: plan, act, observe, reflect, revise. It is appropriate when the researcher is embedded in the setting and collaboration is part of the design.
25. Program evaluation or design-based research
Example question: Does a thesis bootcamp improve student progress, and how should the program be refined?
Program: Bootcamp, mentoring scheme, library workshop, writing lab, online module.
Process variables: Attendance, engagement, fidelity of implementation.
Outcome variables: Proposal completion, writing output, confidence, satisfaction, performance score.
Data collection: Surveys, attendance records, interviews, documents, assessments.
Analysis: Process evaluation, outcome comparison, thematic analysis, implementation review.
Main limitation: Attribution is difficult without a strong comparison group.
Separate the evaluation question into two parts: “Was the program implemented as intended?” and “What changed after implementation?” A program can fail because the theory was weak, or because implementation was incomplete.
How to choose and adapt one design for your thesis
The easiest way to choose a design is to underline the verb in your research question.
Research question verb | Likely design family |
|---|---|
Describe, estimate, measure | Descriptive survey, secondary-data analysis |
Compare | Comparative survey, causal-comparative, quasi-experimental |
Associate | Cross-sectional correlational, observational |
Predict | Predictive correlational, cohort |
Test an intervention | Experimental, quasi-experimental, interrupted time-series |
Explore experience or meaning | Phenomenology, narrative inquiry, qualitative case study |
Develop theory | Grounded theory |
Study a culture or setting | Ethnography |
Evaluate or improve | Program evaluation, action research, mixed methods |
Then define the variables before you fall in love with the design. At minimum, name the outcome, the primary predictor or intervention, possible confounders, moderators, mediators, and the way each will be operationalized.
A weak variable definition sounds like this: “student performance.” A defensible version is narrower: “final proposal score on a 20-point department rubric assessed by two independent raters.” That level of specificity makes the design assessable.
Before committing, check seven constraints:
Participant access: Can you actually reach the people or records?
Sample size: Is the design realistic for the analysis you plan?
Timeline: Can data be collected within the thesis calendar?
Measurement: Are instruments available, valid for your context, or possible to develop?
Permissions: Do you need institutional data access, school approval, clinic approval, or gatekeeper consent?
Ethics: Does the design expose participants to risk, coercion, privacy loss, or unfair treatment?
Analysis skill: Can you defend the analysis method you propose?
A one-paragraph design rationale should connect the whole chain:
This study will use a [design] to examine [question] among [population/sample]. The main explanatory variable will be [variable], and the outcome will be [variable], measured through [instrument/source]. Data will be collected by [method] and analyzed using [analysis]. This design is appropriate because [reason], but it is limited by [main limitation].
That paragraph does more than satisfy a methods chapter convention. It prevents the most common design mistake: making a stronger claim than the design can support.
If you are comparing methodology papers, instruments, adviser comments, and draft design options, a research workspace helps. Otio’s AI PDF reader lets you keep PDFs in a library, highlight passages, ask questions over documents, and save useful selections into notes. If your papers already live in Zotero, Otio also has a Zotero integration for pulling research papers into the workspace.
Use tools to organize the evidence, not to outsource judgment. Your final design still has to be checked against primary methodology sources, ethics rules, and your department’s thesis guidelines.
FAQ
Q: What is the difference between research design and research methodology?
A: Research design is the specific plan for answering a question through sampling, measurement, comparison, and analysis. Methodology is the broader rationale for the approach, such as quantitative, qualitative, mixed-methods, experimental, or interpretive.
Q: How do I choose a research design for my thesis?
A: Start with what the question asks you to do: test an effect, describe a population, examine an association, understand an experience, develop a theory, or evaluate a program. Then check whether the data, participants, measures, timeline, ethics, and analysis are feasible.
Q: Can one thesis use more than one research design?
A: Yes. A thesis can combine designs through mixed methods or multiple phases, such as interviews followed by a survey. Each phase needs a clear purpose and a clear explanation of how the findings connect.
Q: What should I include when describing my research design?
A: State the design, research question, population and sample, variables or concepts, data sources, collection procedures, analysis methods, ethical safeguards, and limitations. Also explain why the design fits the claim your thesis intends to make.
[[OTIO_FOOTER_PROMO:%7B%22title%22%3A%22Ready%20to%20test%20your%20design%20against%20your%20sources%3F%22%2C%22description%22%3A%22Add%20your%20methodology%20papers%2C%20adviser%20comments%2C%20and%20department%20guidelines%20to%20Otio%20to%20compare%20variables%2C%20methods%2C%20and%20limitations%20before%20writing%20your%20rationale.%22%7D]]