
Report Writing
7 Top Tools to Generate Equity Research Reports in 1 Hour
Best AI for report writing slashes equity research time. Discover Otio’s 7 tools that turn 6-hour workflows into 60-minute drafts.
Financial data, earnings reports, and market trends demand swift consolidation into comprehensive equity research. Advanced tools, including the best AI for report writing, transform what used to be days of manual work into a streamlined process. These platforms extract critical insights from complex data, enabling high-quality analysis with minimal delay.
Innovative technology now automates data collection, key point synthesis, and the drafting of professional reports. This efficiency allows professionals to focus on strategic decisions rather than repetitive formatting tasks, while Otio’s AI research and writing partner offers a seamless solution that saves time and enhances report quality.
Summary
Equity research reports typically consume 6–12 hours, not because analysis is inherently slow, but because analysts spend nearly 20% of their time searching for and consolidating information across disconnected platforms, according to McKinsey's 2023 research. The real bottleneck occurs before a single paragraph is drafted, when professionals are still hunting down earnings transcripts from one source, pulling filings from EDGAR, checking Bloomberg for metrics, and storing fragmented notes across multiple tools. This scattered approach forces constant mental reorientation, and research in cognitive psychology shows that task switching can reduce productivity by up to 40% due to context reloading costs.
Fragmented workflows cost businesses an average of $1,800 per employee annually in lost productivity, according to DevOpsSchool Blog, but for equity analysts producing 20–30 reports per year, the real impact is far greater. If each report wastes just 3 hours to fragmentation (90 minutes searching, 60 minutes consolidating, 45 minutes verifying), that's 156 hours per year spent on organization rather than analysis, equivalent to nearly four full workweeks consumed by workflow friction alone. The opportunity cost compounds further when those lost hours could have covered three additional companies, deepened sector expertise, or refined investment theses, rather than vanishing into the gap between data sources and document drafts.
Poor data quality and fragmented systems cost organizations an average of $12.9 million annually, according to IBM's research. While individual analysts don't face losses at that scale, they experience the cost through the quiet frustration of rebuilding the same model structures every quarter. Financial analysts spend approximately 40% of their workday on data gathering and validation rather than on strategic analysis, according to a 2024 Moody's Analytics report, indicating that the bottleneck isn't analytical capability but workflow design. When verification becomes repetitive rather than systematic due to scattered sources, analysts face a specific kind of professional anxiety, constantly questioning whether they transposed figures correctly or missed critical context because the system required them to check the same number in three different places.
The psychological friction of starting equity research reports from a blank document adds 15–30 minutes of unproductive time before momentum builds, and even after insights are clear, formatting for institutional readers consumes an additional 45–90 minutes when structure isn't predefined. This hidden time drain doesn't stem from perfectionism but from meeting the standards institutional readers expect, yet when analysts spend time reformatting rather than refining arguments, they're not adding analytical value. The cumulative effect is most evident in career velocity: capable analysts can't demonstrate their full potential because too much time is lost to workflow friction before analysis materializes at the pace required for career advancement.
The shift from 6–8 hour report cycles to 60-minute first drafts isn't about typing faster or reducing analytical rigor, but about eliminating specific bottlenecks through centralized source management, automated data refresh, and structured note extraction. When sources live in one workspace rather than five scattered platforms, when financial data refreshes automatically rather than requiring manual CSV reformatting, and when transcript insights can be queried conversationally rather than requiring full document rereads, the time distribution shifts from collection and verification to refinement and strategic analysis. The goal isn't to rush analysis; it's to eliminate the 90 minutes spent searching, 75 minutes on manual extraction, and 60 minutes on duplicate verification that traditionally precede the drafting phase.
Otio's AI research and writing partner addresses this by centralizing transcripts, filings, and financial documents in a single, queryable workspace, where analysts can extract structured, source-linked notes and draft reports without switching contexts or manually rebuilding information they've already processed.
Table of Contents
Why Equity Research Reports Take 6–12 Hours to Complete
Equity research reports typically take 6–12 hours to complete, primarily because most of that time is spent collecting, verifying, and organizing information rather than analyzing the stock. The writing itself isn't the problem. Real-time waste occurs before any paragraph is written, when analysts are still searching for numbers, compiling notes, and verifying figures across disconnected platforms. To create a solid equity research report, analysts need access to the latest earnings transcripts, 10-K or 10-Q filings, historical financial data, industry reports, competitor benchmarks, management commentary, and market news. None of these resources is in one place.
You pull numbers from Bloomberg, download filings from EDGAR, read commentary on Seeking Alpha, and store notes in Docs or Notion. Every time you switch between platforms, you have to refocus. According to McKinsey (2023), knowledge workers spend nearly 20% of their time searching for and consolidating information instead of analyzing it. If an analyst works 8 hours on a report, that's about 1.5 hours wasted on searching alone.
What is the cost of mental reorientation?
The cost of mental reorientation is high. It's not just about switching tabs; it involves changing contexts, remembering where one left off, and rebuilding the narrative thread every time a document is revisited. Our AI research and writing partner can help streamline this process for you.
How do analysts spend time before analysis?
Once data is gathered, analysts manually copy financial tables, highlight quotes from transcripts, extract management guidance, and rewrite key metrics in narrative form. This duplication is where major time leakage happens. Analysts are basically changing structured data into written insights, line by line. An analyst covering a SaaS company spends 45 minutes extracting revenue growth and margins, 30 minutes pulling highlights from transcripts, and 25 minutes restructuring that into a summary. That's 1.5 hours gone before the analysis even gets deeper. The report hasn't been written yet, but significant time has already been spent. This is where our AI research and writing partner can help streamline the process, reducing the burden on analysts.
Why is accuracy crucial in equity research?
Equity research requires high accuracy. Analysts double-check revenue figures, year-over-year growth rates, earnings per share (EPS), and guidance. Since notes are often fragmented, these numbers are checked many times. This practice isn't a sign of inefficiency; it's an important part of risk management. When systems aren't centralized, verification becomes repetitive instead of organized. Research in cognitive psychology shows that task switching can reduce productivity by up to 40% because of context reloading. Each time a researcher returns to a document to verify a number, they incur a switching cost. The frustration comes not only from lost time but also from the worry of missing something important; managing too many moving pieces can disrupt concentration and increase errors.
What additional components do reports require?
Even after the insights are clear, equity reports still need additional components. These parts include executive summaries, investment theses, financial breakdown sections, risk disclosures, and valuation frameworks. Formatting for institutional readers can be time-consuming. If the structure isn't set in advance, analysts often spend 45–90 minutes rearranging sections after writing.
How do teams handle formatting challenges?
Most teams handle this by building templates in Word or Google Docs. This helps keep things consistent. However, as reports become more complex and more data sources are used, those templates still need to be completed manually. Important information may be spread across files; numbers need to be rechecked; and putting everything together can take hours or even half a workday. In these situations, having an efficient AI research and writing partner like our Otio can streamline the process and save valuable time.
What solutions exist to streamline the process?
Platforms like Otio bring together research materials by allowing analysts to import sources such as PDFs, earnings calls, and web links into a single platform. Users can consult their research library to quickly find information and write reports without switching tabs. This simpler method reduces the time required to gather and verify information, which typically takes 3–4 hours of scattered work.
Are there misconceptions about the speed of equity research?
Many believe equity research must be slow because it requires financial precision, is complex, and adheres to strict institutional writing standards. While there is some truth to this, it's important to understand that complexity does not mean fragmentation.
What contributes to the long reporting times?
Reports take 6–12 hours to complete, not because finding insights is slow, but because of many workflow problems. The breakdown usually includes 90 minutes for searching, 60 minutes for consolidating, 45 minutes for verifying, and 60 minutes for restructuring. This can add up to more than 4 hours before any detailed analysis even starts.
What is the core issue affecting equity research?
The bottleneck in equity research reporting isn't due to a lack of intelligence; it stems from workflow design. When research inputs are spread out and everything is manual, time can stretch out significantly. On the other hand, when inputs are collected and organized in one place, the writing process becomes much faster, resulting in more efficient outcomes. Our AI research and writing partner helps streamline this process effectively.
How do inefficiencies affect report production?
Scattered inputs cause big challenges, but they are not the only issue. These problems can accumulate in every report you produce, leading to larger issues across the entire production process.
Related Reading
The Hidden Cost of Fragmented Research Workflows

Those inefficiencies don't just slow down one report; they add up across all reports, creating a hidden time tax that grows with each quarter. The cognitive load, repeated verification loops, and constant switching between tasks are not separate issues. They are structural problems that build up. According to DevOpsSchool Blog, fragmented workflows cost businesses an average of $1,800 per employee every year in lost productivity. For equity analysts who make 20-30 reports each year, that figure doesn't show the full impact.
The cost is not only measured in money. It is about missed insights, delayed coverage, and the quiet exhaustion that comes from struggling with your tools instead of using them. If one report is created each week and each report wastes 3 hours due to fragmentation, that means 156 hours are spent annually on organization rather than analysis. This amounts to almost four full workweeks spent on workflow issues.
What is the impact of opportunity cost?
The math gets worse when we think about opportunity cost. Those 156 hours could have been spent managing three more companies, learn more about sectors, or improving investment ideas. Instead, they disappeared into the gap between data sources and document drafts, highlighting the need for an efficient writing partner like our AI research and writing tools.
How does fragmented research lead to anxiety?
The scattered nature of research inputs not only wastes time but also creates a specific kind of professional anxiety. This anxiety stems from the constant worry of missing something important, as the workflow requires checking the same information in three different places. One analyst described this frustration clearly: even though they have all the necessary credentials and experience, the system makes them question their own thoroughness. They know the data is accurate, yet doubt creeps in because they must gather information from five different sources and verify each one manually. They wonder, Did I transpose that margin figure correctly? And was that guidance comment from Q3 or Q4?
What does this indicate about systems and confidence?
This isn't impostor syndrome. It's a reasonable response to fragmented systems without strong structures. When information is kept in separate places, checking it becomes emotional labor rather than analytical work. Most analysts agree that long reporting cycles are necessary because financial rigor requires accuracy. While this idea isn't wrong, it doesn't tell the whole story.
What is the true requirement for precision?
Precision requires accuracy, not fragmentation. Rigor demands thoroughness, not duplication. Institutional standards emphasize clarity, not a scatter of inputs. What seems like necessary complexity often comes from old workflow designs. These processes were created before centralized research platforms were available, before AI could structure unstructured data, and before synthesis could be automated without losing control. Our AI research and writing partner can help streamline these workflows for better clarity and efficiency.
Why do teams continue with fragmented approaches?
Teams continue to use the same fragmented approach because it is good enough. They depend on Bloomberg for data, EDGAR for filings, Excel for models, and Docs for drafts. Each tool has its own purpose; however, the problem lies not in the tools themselves, but in the cognitive overhead of assembling them by hand, report after report.
What is the main challenge in data transformation?
The real challenge isn't just collecting data; it's turning that data into a clear story while keeping detailed analysis. When reading the earnings transcript, you spot three main themes. Revenue numbers come from the 10-Q, and you notice changes in management's tone about margins. Then, open a blank document to consolidate the context from what you remember and your notes. To streamline this process, consider how our AI research and writing partner helps organize insights efficiently.
Why does time disappear during the reconstruction process?
During the reconstruction process, time tends to vanish. It involves more than just writing; you are also holding multiple contexts in your working memory. This requires cross-referencing sources that aren't visible simultaneously and reformatting information you have already processed. To manage this complexity, most teams develop detailed note-taking systems in Notion or Evernote to improve organization. However, as the report becomes more complex and the number of sources increases, these notes still need to be manually put together into the final narrative. While the thinking is complete, the translation work remains. Our AI research and writing partner streamlines this process, helping teams to craft cohesive narratives efficiently.
How does Otio help reduce workflow friction?
Platforms like Otio make the synthesis phase easier by allowing analysts to consolidate all their sources in one place, such as PDFs, transcripts, and web links. They can ask questions about their research library in a conversational way and write directly from organized insights, so they don’t have to manually reconstruct context. This method removes the reconstruction delay that usually takes 2-3 hours per report.
What are the long-term costs of fragmented workflows?
The long-term cost of fragmented workflows extends beyond lost time. It greatly affects career progression. When people spend 60% of their day managing information logistics instead of generating insights, their analytical output does not reflect their true abilities. They could build deeper knowledge in their field, develop more detailed investment ideas, and expand their coverage more quickly. However, the workflow issues prevent this potential from being noticed. Our AI research and writing partner helps streamline these processes, ensuring that the focus remains on generating valuable insights.
How do junior analysts experience workflow bottlenecks?
Junior analysts feel this bottleneck strongly. They have the technical skills, financial modeling knowledge, and research discipline needed for success. However, they struggle to advance because their resumes often lack sufficient published coverage or distinctive insights. Even though they have the ability, the current workflow stops their potential from developing at the speed needed for career growth.
What gap is created by workflow friction?
This creates a frustrating gap. You know what you can analyze, but your results don't show it. Too much time is lost due to workflow friction, which slows progress before analysis even begins. Our AI research and writing partner helps streamline your workflow, ensuring that you can focus on what really matters.
Could the solution be to change the system?
What if the solution isn't about working harder within a broken system? In this context, having an effective AI research and writing partner can be vital. Our Otio platform streamlines research processes, allowing you to focus on innovative solutions.
The 7 Top Tools That Remove Specific Bottlenecks
Speed doesn't come from accumulating tools. It comes from eliminating the exact moments where your workflow stalls. The question isn't "what tools exist?" It's "what specific task does each tool remove, and how many minutes does that realistically save?" The difference between an 8-hour report cycle and a 3-hour structured workflow isn't intelligence. It's bottleneck removal.
1. Otio (Centralized Research Synthesis)
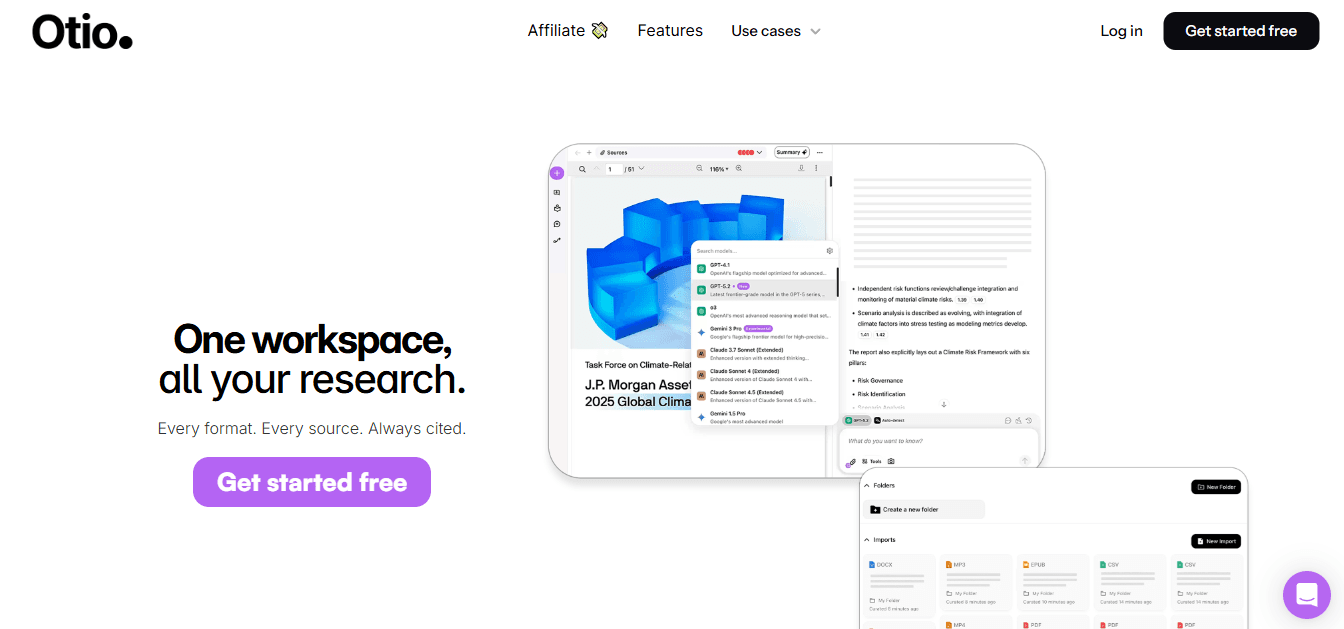
What it replaces
copying transcript quotes into notes, manually summarizing SEC filings, rewriting highlights into structured insight, and switching between five or more tabs to verify context.
What it does instead
centralizes transcripts, filings, PDFs, and articles in a single workspace. You upload sources once, query your entire research base conversationally, and extract structured notes directly tied to the source material. The platform generates outlines from uploaded content, eliminating the reconstruction bottleneck that typically consumes 90 to 120 minutes per report. The mechanism matters here. Instead of reading, highlighting, copying, rewriting, and then checking again, you upload once and extract structured insight directly. That eliminates duplication at the point where most time vanishes.
Time impact
60 to 120 minutes saved per report, plus reduced repetitive re-verification cycles. Most teams handle synthesis by building detailed note-taking systems in Evernote or Notion, which helps with organization. As source volume grows and report complexity increases, those notes still require manual translation into final narrative form. Otio streamlines this by enabling analysts to import diverse sources (PDFs, earnings calls, web links), chat with their research library for instant retrieval, and draft reports without switching contexts. This addresses the fragmentation problem where thinking has been done, but translation work remains.
2. Bloomberg Terminal (Financial Metric Retrieval)
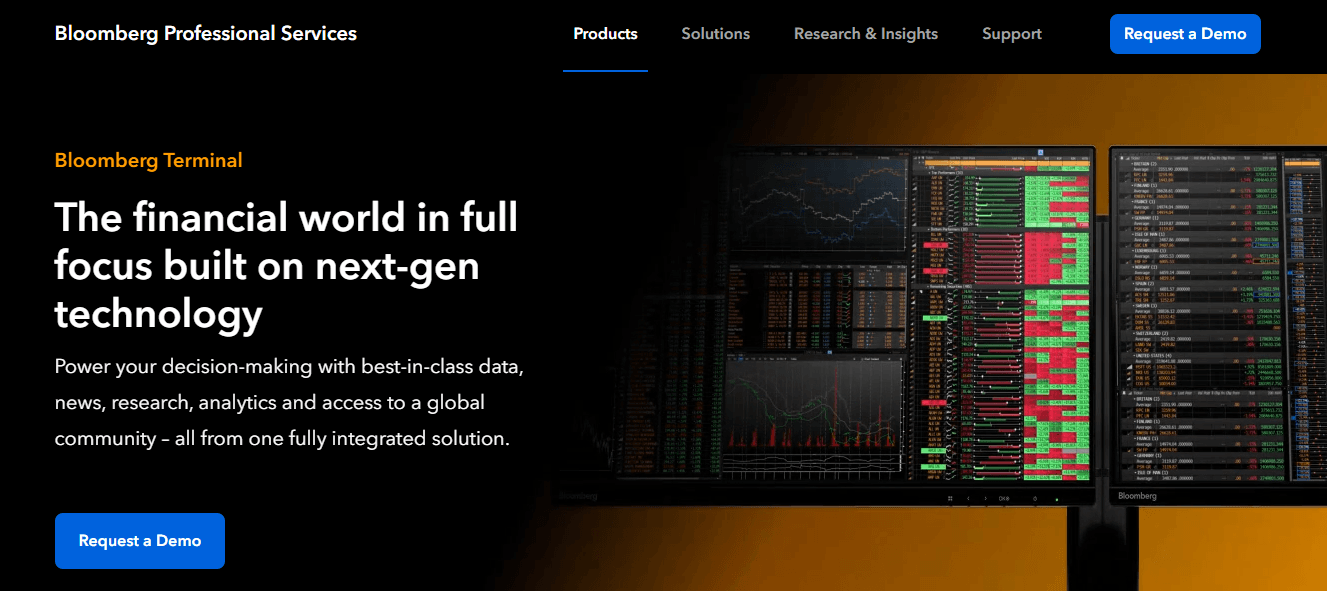
What it replaces
pulling revenue, margins, and historical EPS manually, then cross-checking across multiple financial summaries to ensure accuracy.
What it does
provides a centralized financial database with historical data comparisons and instant metric retrieval. Financial lookup moves from document search to structured query.
Time impact
30 to 45 minutes saved per report. The value isn't just speed. It's confidence. When numbers come from a single authoritative source instead of three different PDFs, verification anxiety decreases. You're not questioning whether you transposed a figure correctly, because the system ensures structural consistency.
3. Refinitiv Eikon (Peer Benchmarking)
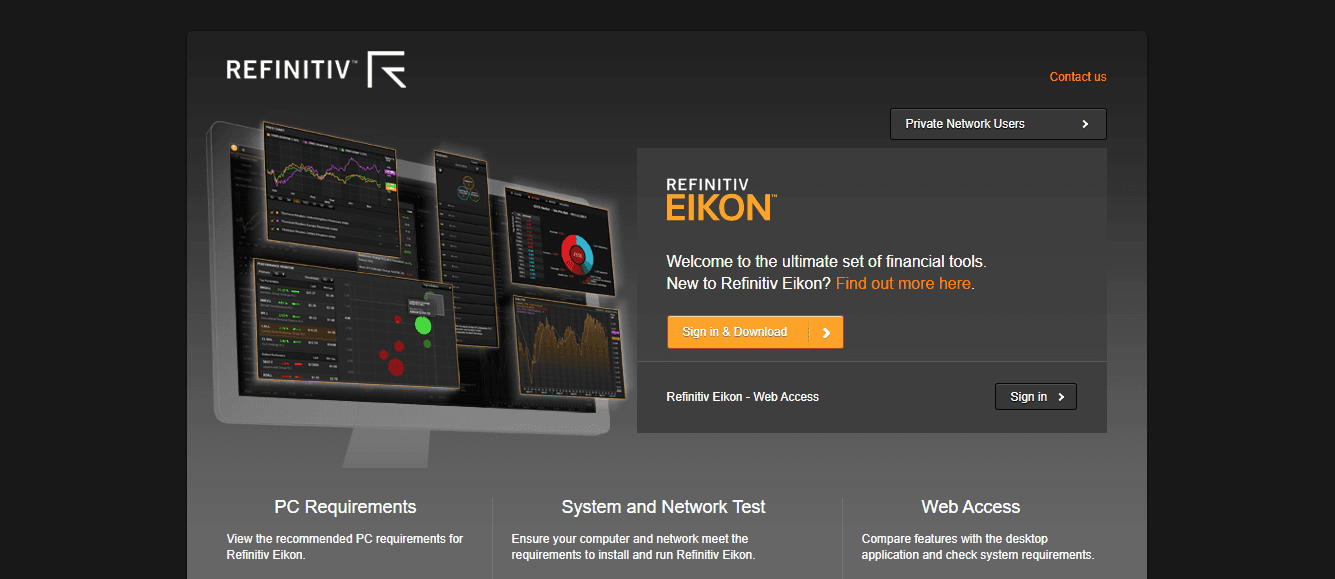
What it replaces
manually comparing sector peers, exporting multiple company metrics, and building Excel tables from scratch to establish relative positioning.
What it does
provides pre-structured peer benchmarking data. Comparative analysis becomes a query instead of a construction project.
Time impact
20 to 40 minutes saved. The hidden benefit is cognitive. When peer data is pre-aggregated, you spend time interpreting patterns instead of assembling spreadsheets. Your brain stays in analytical mode rather than toggling between data entry and insight generation.
4. AlphaSense (Transcript Search Precision)
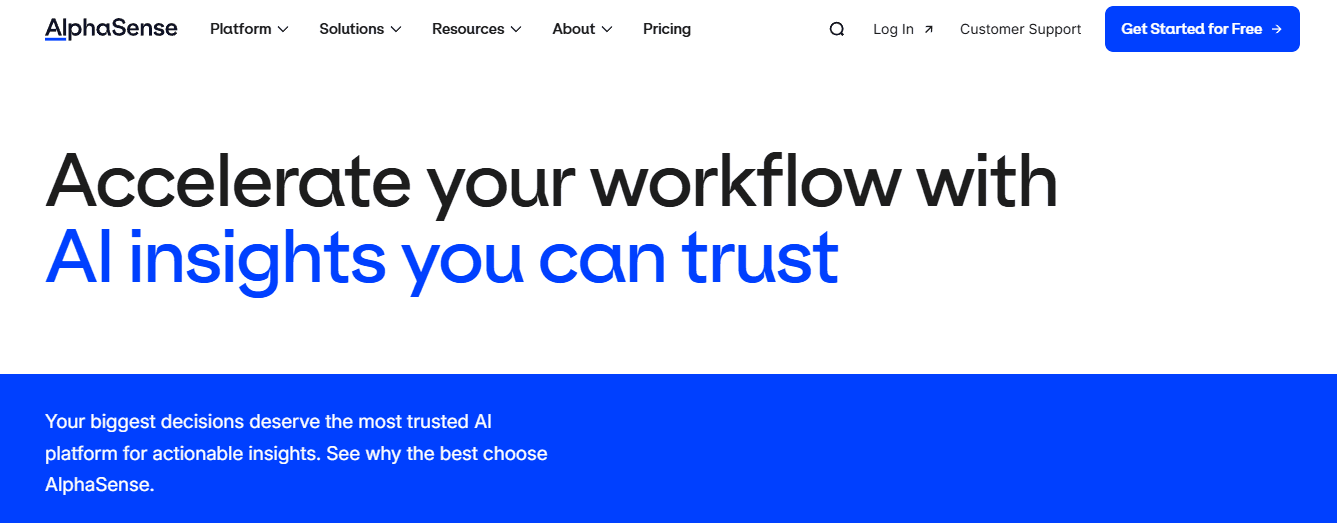
What it replaces
reading entire earnings calls to find specific commentary, scanning PDFs for keywords, and manually extracting management tone shifts.
What it does
enables keyword-level precision across thousands of transcripts. You search for "margin pressure" or "supply chain" and surface every relevant mention across quarters and competitors.
Time impact
30 to 60 minutes saved. This tool addresses a specific frustration: knowing the insight exists somewhere in a 40-page transcript, but not wanting to reread the entire document to find it. Precision search turns that hunt into a 30-second query.
5. Excel with Power Query (Automated Data Refresh)
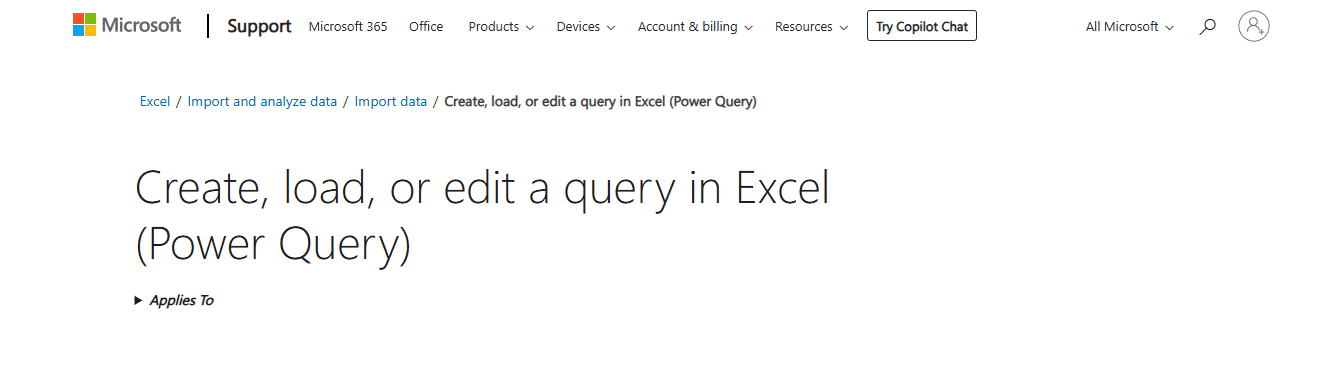
What it replaces
reformatting CSV exports, recalculating recurring models, and manually refreshing data every time a new quarter's financials are released.
What it does
automates data refresh. Once the query is set up, updated data flows into your model without manual intervention. Repetitive modeling setup vanishes.
Time impact
45 to 60 minutes saved per report cycle. According to IBM, poor data quality costs organizations an average of $12.9 million annually. For individual analysts, the cost isn't measured in millions. It's measured in the quiet frustration of rebuilding the same model structure every quarter because the workflow wasn't designed for reuse.
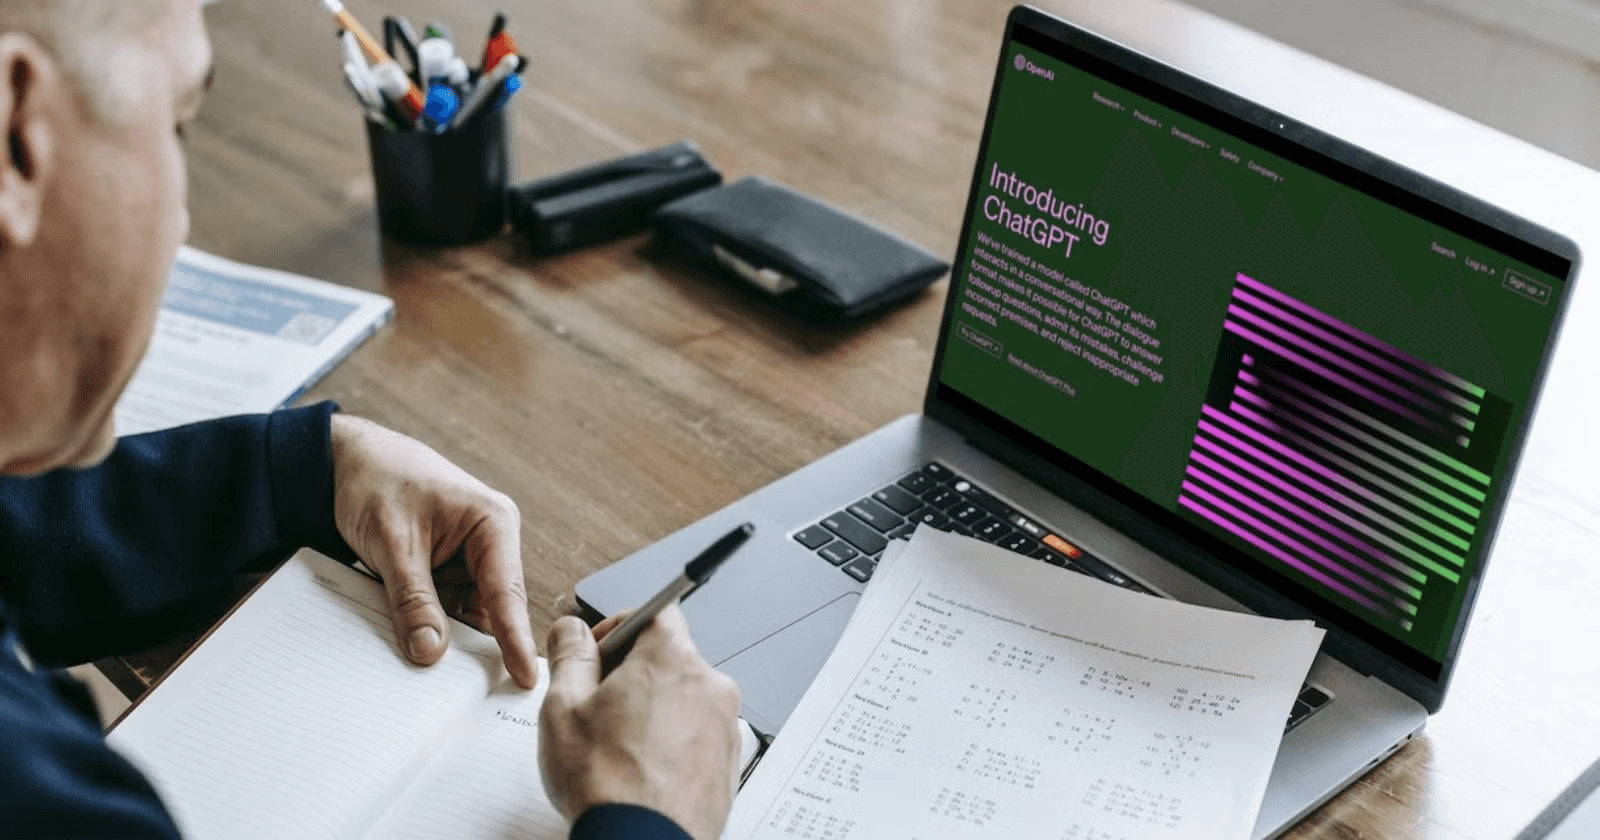
6. ChatGPT (Strategic Outline Generation)
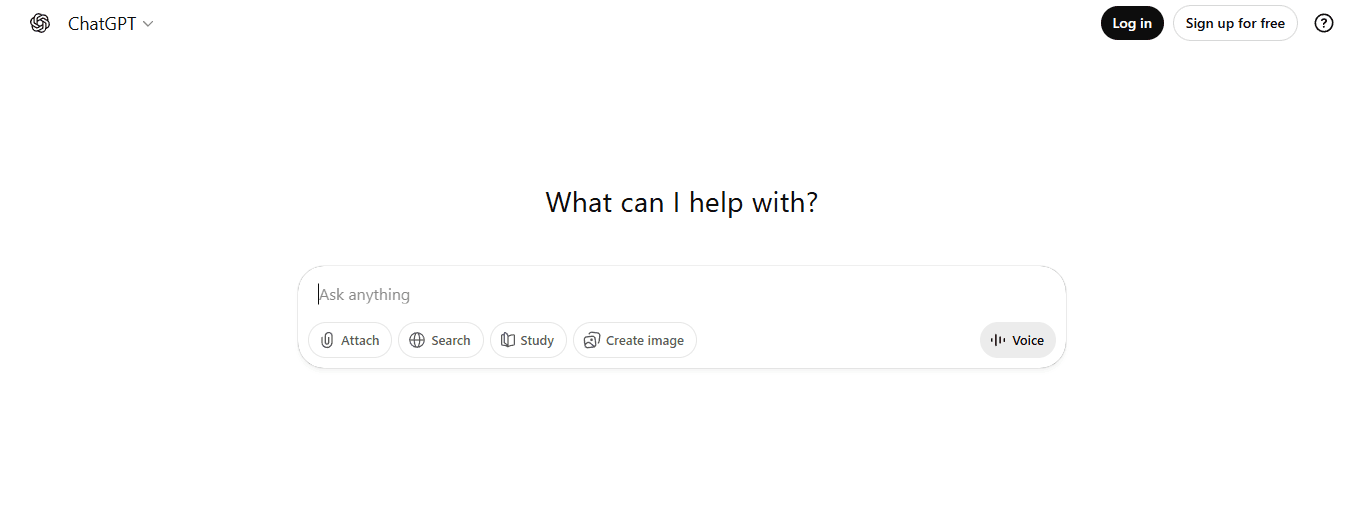
What it replaces
staring at a blank document, structuring sections from scratch, and overcoming the psychological friction of starting.
What it does
generates predefined outlines to accelerate momentum in the first draft. Used carefully (not as a data source), it removes blank page paralysis.
Time savings
15 to 30 minutes. The value isn't in the content ChatGPT produces. It's in the momentum it creates. Starting is harder than continuing. A rough outline, even if you rewrite 80% of it, gives you something to react against instead of a blinking cursor.
6. Structured Report Templates (Reusable Formatting)
What it replaces
rebuilding executive summary sections, reorganizing valuation formats, and repeating risk disclosure structures every time you draft a new report.
What it does
makes the structure reusable rather than requiring it to be recreated. Formatting becomes a one-time setup rather than a recurring task.
Time savings
30 to 60 minutes. Templates aren't just about aesthetics. They're about cognitive load. When section structure is predefined, your brain can focus entirely on content quality rather than splitting attention between "what should I say" and "where should this go."
What This Actually Means
If you combine 90 minutes saved on synthesis, 45 minutes saved on financial lookups, 45 minutes saved on data cleaning, and 60 minutes saved on restructuring, you've realistically reduced friction by 3 to 4 hours per report. That's before considering the cognitive switching reduction, which doesn't show up in direct task timing but compounds across every transition. The bottleneck isn't your ability to analyze. It's the accumulated friction of fragmented systems that forces you to rebuild context manually, report after report. But knowing which tools remove which bottlenecks is only half the picture. The other half is understanding how they fit together in a workflow that actually compresses time instead of just redistributing it.
The 60-Minute Equity Research Workflow (Annotated Timeline)
Generating an equity research draft in 60 minutes isn't just about typing faster; it's about using that hour for writing instead of searching. The timeline below shows how each minute is spent when friction is removed before drafting begins. This isn't a quick analysis, but a well-organized preparation process that ensures the actual writing is linear and uninterrupted. Using Otio's features lets you seamlessly integrate AI research and writing assistance into your workflow.
Why is centralized sourcing important?
Upload the latest earnings transcript, 10-K or 10-Q filing, financial summary export, and any relevant industry commentary into one workspace. This way, everything is in a single location before you start drafting. This process is important because it saves 60 to 90 minutes you would otherwise spend switching between Bloomberg, EDGAR, and various PDFs. By organizing everything up front, drafting becomes easier and smoother. The change in mindset is big. When all your sources are in one place, you don’t have to worry about where that margin comment was hidden or if the updated guidance table was saved. Everything is easy to find without the stress of switching contexts.
How does centralization impact analysis?
Centralized research platforms help analysts to systematically get revenue trends, margin changes, forward guidance, management tone, and risk disclosures. This method shortens the traditional manual summarization process. Instead of spending time reading 60 pages and manually highlighting passages, the platform creates structured, source-linked notes in just minutes. While the tool does not replace critical thinking, it eliminates the need to read, copy, rewrite, and verify the same content multiple times. Our AI research and writing partner facilitates this process, enabling smarter, faster analysis. This leads to significant time savings by eliminating 60 to 90 minutes of manual extraction and an additional 20 to 30 minutes typically spent on repetitive rewriting.
What Questions Should You Ask of Your Notes?
Most teams handle this by creating detailed highlighting systems in PDFs or note-taking apps, which helps with remembering information. However, as the number of sources increases and deadlines tighten, those highlights still need to be manually translated into narrative form. Platforms like Otio make this process easier by allowing analysts to import various sources, such as PDFs, earnings calls, and web links. Analysts can ask questions about their research library in a conversational way and get organized insights without having to recreate the context by themselves. This solution addresses the translation issue: thinking has been done, but synthesis is still needed.
Think about asking structured questions about your combined notes. Some important questions could be: What are the top three growth drivers? What are the top three risks? Is the guidance conservative or aggressive? What has changed since last quarter? Instead of rereading entire transcripts to answer every question, you can pull together information from structured notes that have already been collected. This allows the analysis to occur in one place rather than across five tabs. For more tips on effective analysis, see our sentiment analysis. Time saved: 45 to 75 minutes of going over the same material repeatedly and doing multiple checks.
What does the drafting process look like?
Cognitive switching decreases because there’s no need to rebuild context each time you change from revenue analysis to risk assessment. The narrative thread stays intact. Next, you write the executive summary, investment thesis, financial overview, risk analysis, and valuation summary. Since the data is already structured, insights have been gathered, and numbers are centralized, this hour is dedicated to writing, not administration. The realistic outcome is a structured first draft, not a final polish. However, it's draft-ready, so refinement can begin immediately rather than waiting for the initial build to finish.
How do traditional and structured workflows compare?
In a traditional workflow, tasks take a lot of time: 90 minutes are spent searching, 75 minutes on extracting notes, 60 minutes on checking, and 120 minutes on writing. This totals 6 to 8 hours. On the other hand, a structured workflow accelerates the process. It starts with 10 minutes for centralizing everything, then 15 minutes for structured notes, 15 minutes for identifying themes, and 20 minutes for drafting. In total, drafting this structure takes about 60 minutes. Although fully refining the document still takes 1 to 2 hours, the time required to create the first draft decreases significantly, especially with tools like Otio that streamline the writing process and enhance collaboration.
What common beliefs about equity reports are there?
The belief that equity reports must take a full day stems from past practices in which analysts prepared reports by hand. Tools were separate, and ensuring accuracy required repeated checks. These ideas were sensible in older workflows. When sources are gathered in one place and notes are organized, insights can be easily searched, and drafts follow a set format. In this situation, the slow part shifts from gathering information to improving it, and improving it is faster than rebuilding it. Utilizing an AI research and writing partner, like our product, can significantly enhance the efficiency of your report creation.
What does research say about analyst time distribution?
According to Moody's Analytics (2024), financial analysts spend approximately 40% of their workday on data gathering and verification rather than on strategic analysis. This isn't a problem with their skills; it's a problem with how their workflow is designed. When the structure changes, the way they spend their time changes too. The goal isn't just to write faster; it's to eliminate unnecessary searching, repetitive summaries, double-checking, and the need to rebuild the structure every time. Once these wasted efforts are addressed, the one-hour draft becomes feasible, not just a theory. Our AI research and writing partner helps streamline this process. Knowing the timeline is helpful, but what really matters is understanding what each stage eliminates. This difference is what separates theory from execution.
Related Reading
Generate Your Next Equity Research Draft in 60 Minutes
If equity research reporting still takes you 6 to 12 hours, it's usually not because your analysis is slow. The real problem is that your sources and notes are scattered. This means you spend a lot of time searching, summarizing, and checking everything again before you even start writing. The workflow itself is the problem, not your skills.
Create a free Otio workspace and upload just three sources for your next report: the latest earnings call transcript, the most recent 10-Q or 10-K (PDF), and your model export or financial summary. In just 15 minutes, you'll get organized, source-linked notes, so you won't have to rewrite highlights, a searchable knowledge base for easy figure retrieval, and an outline ready for drafting. This helps you keep to the 60-minute timeline from the previous section. Instead of wasting 1 to 2 hours switching between tabs and performing manual extraction, you will centralize, extract, and draft in a single step.
With this method, you can focus your time on what investors actually care about: the thesis, risks, and valuation logic. If your last report took 6 to 8 hours, use the structured workflow for your next report and see the difference. You can realistically produce the first draft in under 60 minutes, with edits done afterward. For those looking for a smart writing companion, Otio's AI research and writing partner can significantly enhance your efficiency.
Related Reading
Document Generation Tools
How To Use Ai For Literature Review
How To Write A Research Summary
How To Write A White Paper
Best Ai For Literature Review
Best Report Writing Software


