
Research Methodology
18 Best Correlational Research Design Examples for College Assignments
Get 18 assignment-ready correlational research design examples with variables, research questions, suitable analyses, and limitations. Use the guide to choose and narrow a college research topic without implying causation.

If your assignment asks for a correlational research design, the safest topic is one where both variables can be measured without assigning students to conditions. Good examples include study hours and GPA, attendance and exam scores, social media use and stress, caffeine intake and sleep quality, or AI-tool use and writing confidence.
The trick is not picking a clever topic. It is stating the relationship clearly, defining each variable before collecting data, choosing an analysis that fits the data type, and refusing to write causal language like “causes,” “improves,” or “reduces.”
What makes a strong correlational research design example?
Correlational research examines whether two or more measured variables are related. The defining feature is that the researcher measures variables rather than manipulating them; neither variable is assigned as a treatment condition, according to the open research methods text from Texas State University Pressbooks.
That means a correlational study can show that students who report more weekly study hours also tend to have higher GPAs. It cannot show that studying more caused the higher GPA. Prior preparation, course difficulty, motivation, health, instructor quality, and study efficiency may all be involved.
A strong college-level example usually has six parts:
Part | What to specify | Example |
|---|---|---|
Population | Who the study is about | First-year psychology students at one college |
Variable 1 | First measured variable | Weekly study hours |
Variable 2 | Second measured variable | Semester GPA |
Research question | Neutral relationship question | Is there a relationship between weekly study hours and semester GPA? |
Possible analysis | Statistical approach | Pearson correlation or simple linear regression |
Limitation | Why correlation is not causation | Study quality and prior preparation may confound the result |
Define the variables before writing the title. “Social media use” is too vague. “Average daily social-media minutes during the past seven days” is measurable. “Academic performance” is vague. “Final exam percentage” or “semester GPA” is measurable.

Positive, negative, and no detectable correlation
A positive correlation means both variables tend to increase together. For example, study time and grades may show a positive relationship if students who study more tend to earn higher scores.
A negative correlation means one variable tends to increase as the other decreases. For example, more screen time before bed may be associated with shorter sleep duration.
A zero or no detectable correlation means the data do not show a clear relationship. For example, the number of colored pens used for note-taking may have no meaningful association with quiz performance.
Which analysis fits?
Use the analysis your variables can support:
Pearson correlation: best for two approximately continuous variables, such as weekly study hours and GPA, when the relationship is roughly linear and assumptions are reasonable.
Spearman correlation: better for ranked, ordinal, skewed, or nonnormally distributed variables, such as “never/rarely/sometimes/often” responses.
Regression: useful when modeling an outcome or adding control variables, such as predicting exam score from attendance while adjusting for prior GPA.
If your topic involves one categorical variable, such as note-taking method with groups like handwritten, typed, and AI-assisted, a simple correlation may not be the right test. You may need a group comparison instead. For a broader explanation of the design itself, see Otio’s guide to types of correlational research design.
Academic performance and study-behavior examples
These topics are usually the easiest to turn into a college assignment because the variables are familiar, measurable, and tied to existing education literature. The risk is overclaiming. Academic performance is shaped by many variables at once.
A cross-sectional study on study time, sleep duration, course difficulty, and exam results notes that prior research has found positive associations between study time and academic performance, while some studies report no significant effects in particular contexts PMC. That is exactly why correlational assignments should include limitations.
1. Study time and GPA
Population: Undergraduate students in one semester.
Variables: Weekly study hours and semester GPA.
Research question: Is there a relationship between weekly study hours and semester GPA among undergraduate students?
Possible analysis: Pearson correlation if both variables are continuous and reasonably distributed; simple linear regression if GPA is modeled as the outcome.
Limitation: Study efficiency, prior preparation, course difficulty, and motivation may influence both study time and GPA. More hours do not necessarily mean better studying.
2. Class attendance and exam scores
Population: Students enrolled in one course section.
Variables: Attendance percentage and final exam score.
Research question: Is attendance percentage related to final exam performance in this course?
Possible analysis: Pearson correlation.
Limitation: Attendance may reflect motivation, health, transportation access, or work schedules. A single course also limits generalizability.
This is a clean assignment topic because attendance percentage and exam score are both numeric. It becomes stronger if the course allows access to records in an ethical, anonymized way.
3. Sleep duration and academic performance
Population: Full-time college students.
Variables: Average nightly sleep duration and semester GPA or exam score.
Research question: Is average nightly sleep duration associated with academic performance among full-time students?
Possible analysis: Pearson correlation for continuous sleep-hour and GPA data; Spearman correlation if sleep is measured in categories.
Limitation: Self-reported sleep can be inaccurate. Workload, stress, employment, and health conditions may affect both sleep and grades.
A common mistake is writing, “The effect of sleep on GPA.” That sounds causal. Use “relationship between sleep duration and GPA” instead.
4. Academic procrastination and assignment grades
Population: Students in writing-intensive or project-based courses.
Variables: Academic procrastination questionnaire score and average assignment grade.
Research question: Is procrastination level associated with average assignment grades?
Possible analysis: Spearman correlation if the questionnaire produces ordinal scores; Pearson correlation may be acceptable if the total scale score is treated as continuous and assumptions are reasonable.
Limitation: Stress, time-management skills, course structure, mental health, and deadline flexibility may affect both procrastination and grades.
This topic works best if you use an established procrastination scale rather than inventing three casual questions the night before submission.
5. Note-taking method and quiz performance
Population: Students in one lecture-based course.
Variables: Quantified note-taking behavior score and quiz score.
Research question: Is note-taking behavior associated with quiz performance?
Possible analysis: Pearson or Spearman correlation if note-taking is measured numerically, such as completeness score, review frequency, or number of lecture concepts captured.
Limitation: If “note-taking method” is simply categorized as handwritten, typed, or annotated slides, correlation may not be appropriate. That version is closer to a group comparison design.
A better correlational version is: “relationship between weekly note-review frequency and quiz scores.” That gives you two measurable variables.
6. Use of academic support services and course GPA
Population: Students enrolled in a course with tutoring, office hours, or writing-center support.
Variables: Number of support-service visits and course GPA.
Research question: Is the number of academic support visits associated with course GPA?
Possible analysis: Spearman correlation if visits are counts with skewed distribution; regression if including prior GPA or baseline exam score as a control variable.
Limitation: Selection bias is likely. Students who seek help may already be struggling, while high-performing students may use office hours strategically.
A study could find a negative relationship if students with more visits have lower grades. That would not prove tutoring harms performance. It may show that students with greater academic difficulty seek more help.
Health, well-being, and student-life examples
Student-life topics are engaging, but they often involve sensitive information. Keep surveys anonymous when possible, avoid collecting unnecessary identifiers, and be careful with mental-health, financial, and sleep data.
For stress-related topics, established scales are better than improvised wording. The Pew Research Center describes using the Perceived Stress Scale to measure how overloaded, unpredictable, and uncontrollable people perceive their lives to be. That kind of operational definition is much stronger than asking, “Are you stressed?”
7. Social media use and perceived stress
Population: Undergraduate students at one college.
Variables: Daily social-media minutes and perceived-stress score.
Research question: Is daily social-media use associated with perceived stress among undergraduate students?
Possible analysis: Pearson correlation if minutes and stress scores are suitable; Spearman correlation if usage is reported in categories.
Limitation: Direction is unclear. Stressed students may use social media more, social media may contribute to stress, or a third variable may affect both.
A study of college students’ social media data and perceived stress found associations between social media indicators and psychological health measures, but the design still supports association rather than simple causation PMC.
8. Physical activity and depressive-symptom scores
Population: College students enrolled in general education courses.
Variables: Weekly physical-activity minutes and depressive-symptom questionnaire score.
Research question: Is weekly physical activity related to depressive-symptom scores among college students?
Possible analysis: Spearman correlation if activity minutes are skewed; regression if adding control variables such as year level or employment hours.
Limitation: Health status, disability, socioeconomic factors, access to recreation spaces, and self-selection can influence both variables.
This is a good example because it is intuitive but still methodologically cautious. Do not write that exercise “reduces depression” unless your assignment is experimental or intervention-based.
9. Caffeine consumption and sleep quality
Population: Students living on or near campus.
Variables: Daily caffeine servings and sleep-quality score.
Research question: Is daily caffeine consumption associated with sleep quality among college students?
Possible analysis: Spearman correlation, especially if servings are reported in categories or sleep quality is ordinal.
Limitation: Students may consume caffeine because they already sleep poorly. Serving sizes also vary across coffee, energy drinks, tea, and supplements.
Ask for a specific time window, such as “average daily caffeine servings during the past seven days.” Otherwise, students will answer using different assumptions.
10. Financial stress and college belonging
Population: Students receiving financial aid or all students at one institution.
Variables: Financial-stress scale score and college-belonging scale score.
Research question: Is financial stress related to students’ sense of belonging at college?
Possible analysis: Pearson correlation if both scale scores can reasonably be treated as continuous.
Limitation: Employment hours, housing stability, family obligations, financial aid, and campus support may all confound the relationship.
This topic is meaningful but sensitive. Do not ask for exact family income unless the assignment truly requires it. A financial-stress scale is usually more appropriate.
11. Commute time and student satisfaction
Population: Commuter students at one campus.
Variables: One-way commute duration and college-life satisfaction score.
Research question: Is commute time associated with satisfaction with college life among commuter students?
Possible analysis: Pearson correlation or regression.
Limitation: Transportation mode, class schedule, campus involvement, living arrangements, and employment may explain part of the association.
This design is strongest when the population is narrowed to commuters. Including residential students with zero commute time may distort the relationship.
12. Screen time before bed and daytime fatigue
Population: Students aged 18 or older in one college.
Variables: Screen-use duration during the hour before bed and daytime-fatigue score.
Research question: Is pre-sleep screen time associated with daytime fatigue?
Possible analysis: Pearson or Spearman correlation depending on measurement.
Limitation: Self-report error is likely. The design also cannot determine whether screen use contributes to fatigue or fatigued students spend more time scrolling at night.
A practical measurement option is to ask students to estimate minutes of screen use before sleep over the past three nights, then average the values.
[[OTIO_INLINE_PROMO:%7B%22title%22%3A%22Need%20to%20verify%20a%20scale%20and%20its%20limitations%3F%22%2C%22description%22%3A%22Save%20the%20study%2C%20measurement%20scale%2C%20and%20source%20notes%20in%20Otio%2C%20then%20ask%20questions%20across%20them%20before%20choosing%20variables%20for%20your%20assignment.%22%7D]]
Technology, relationships, and social-behavior examples
These topics fit current student life, but the variables can get fuzzy. “Engagement,” “confidence,” “support,” and “belonging” need measurement rules.
If you use platform data, define exactly what counts. Logins, minutes watched, discussion posts, assignment clicks, and completed modules are not interchangeable.
13. Online learning engagement and course satisfaction
Population: Students in online or hybrid courses.
Variables: Learning-platform engagement score and course-satisfaction rating.
Research question: Is online learning engagement associated with course satisfaction?
Possible analysis: Pearson correlation or regression.
Limitation: Engagement metrics may reflect course design, grading pressure, assignment structure, or instructor communication rather than student attitude alone.
This example works well if the instructor provides anonymized engagement data. If not, a self-reported engagement scale is easier but less precise.
14. Frequency of AI-tool use and writing confidence
Population: Students in first-year writing or composition courses.
Variables: AI-tool use frequency and writing-confidence score.
Research question: Is frequency of AI-tool use associated with students’ writing confidence?
Possible analysis: Spearman correlation if AI use is measured as never, rarely, sometimes, often, very often.
Limitation: Confident writers may be more likely to experiment with AI tools. Course policies and prior writing experience may also shape both variables.
For this topic, define AI-tool use carefully. Brainstorming, grammar correction, outlining, summarizing readings, and generating draft text are different behaviors.
15. Messaging frequency and perceived social support
Population: Students living away from home.
Variables: Weekly number of messages or calls with friends/family and perceived-social-support score.
Research question: Is messaging frequency associated with perceived social support?
Possible analysis: Spearman correlation because message counts are often skewed.
Limitation: Message count does not capture relationship quality. A student may send many routine messages without feeling supported.
A stronger version separates communication types: family calls, close-friend messages, group chats, and academic messages.
16. Roommate conflict and sleep quality
Population: Students living with roommates.
Variables: Roommate-conflict frequency and sleep-quality score.
Research question: Is roommate conflict associated with sleep quality among students in shared housing?
Possible analysis: Spearman correlation.
Limitation: Privacy concerns are real. Shared living conditions, room size, noise, work schedules, and personality differences may influence both conflict and sleep.
This topic should avoid collecting names, dorm rooms, or identifying details about roommates. Keep the unit of analysis on the respondent.
17. Volunteer participation and civic engagement
Population: Students involved in campus or community organizations.
Variables: Monthly volunteer hours and civic-engagement score.
Research question: Are volunteer hours related to civic-engagement scores among college students?
Possible analysis: Pearson correlation or regression.
Limitation: Students who are already civically engaged may be more likely to volunteer. Family background, major, religious participation, and political interest may also matter.
This is a clean social-behavior topic because both variables can be measured without much sensitivity, especially if hours are reported in broad ranges.
18. Perceived campus safety and event participation
Population: Students attending an urban, suburban, or residential campus.
Variables: Campus-safety perception score and number of campus events attended.
Research question: Is perceived campus safety associated with campus-event participation?
Possible analysis: Spearman correlation if event attendance is a count or ordinal range.
Limitation: Event availability, schedule, personality, transportation, campus location, and friend-group participation may influence both variables.
This design gets stronger if the time frame is specific: “events attended in the past month” rather than “events attended in college.”
How to turn one example into a college research assignment
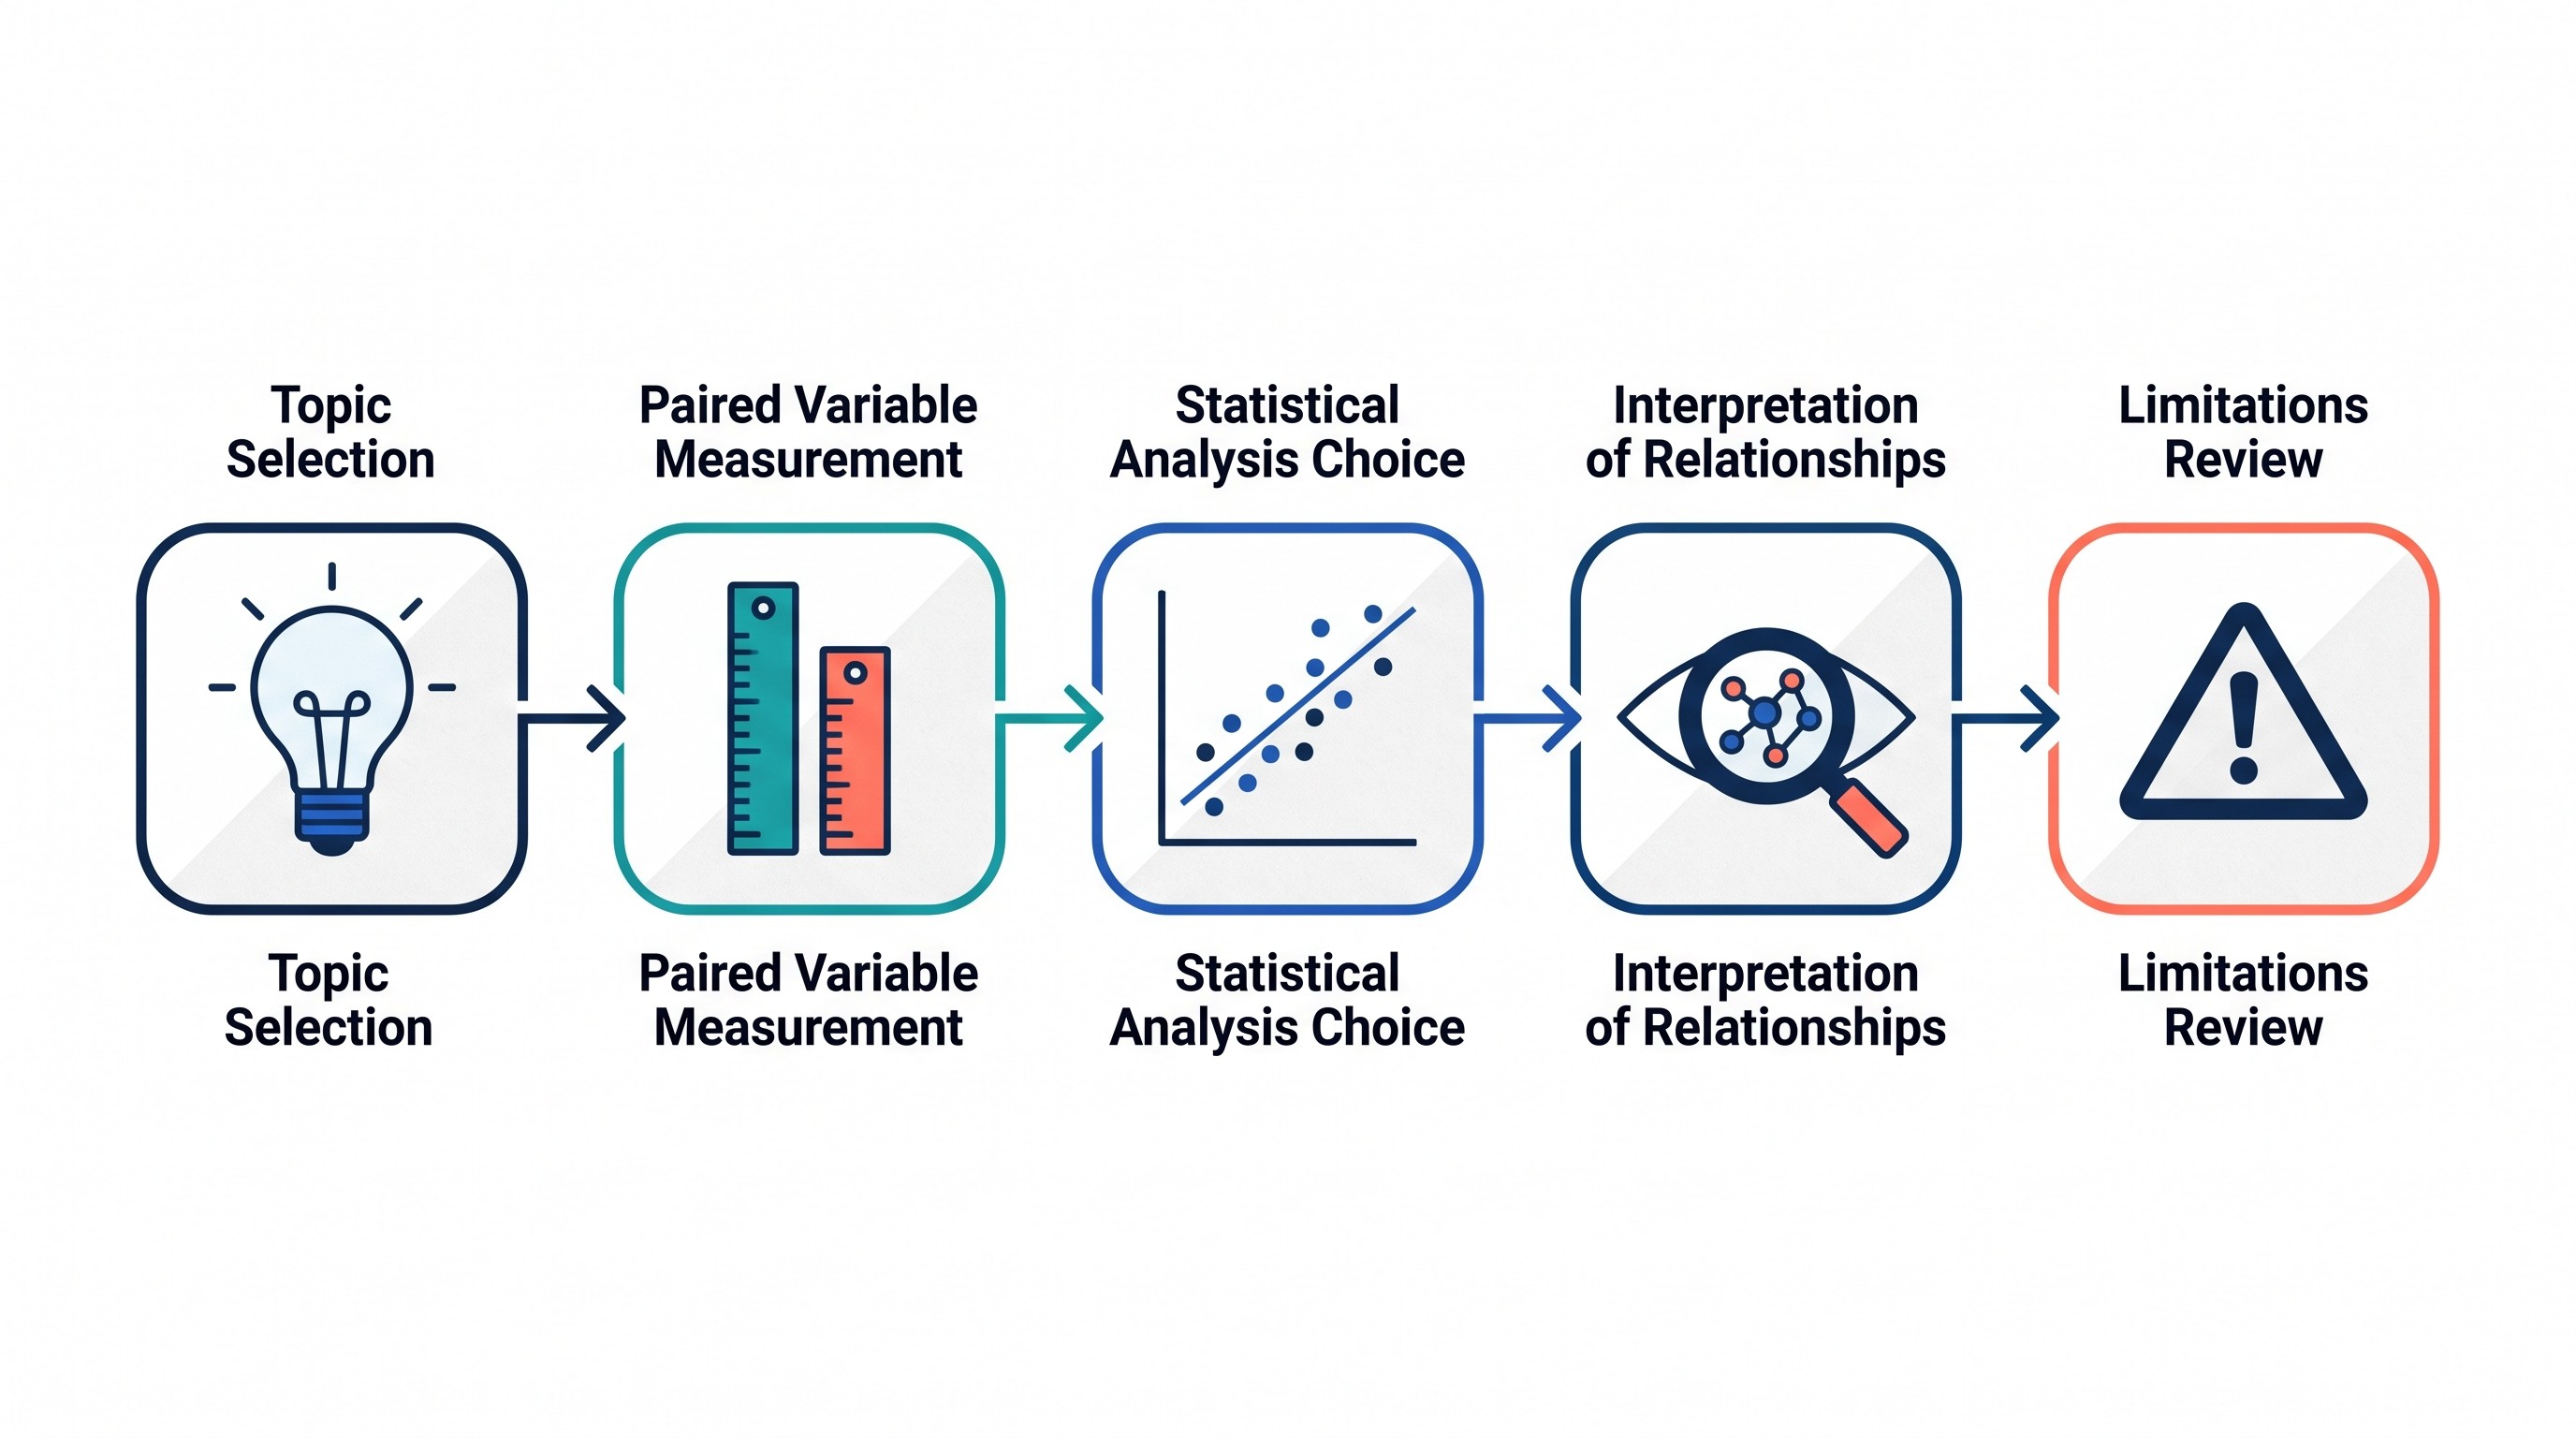
Pick one example and narrow it until it can actually be done. “College students” is too broad for most assignments. “First-year students in two sections of Introduction to Psychology at one college during the spring semester” is manageable.
If you need a fuller framework for method, sampling, and measurement choices, Otio has a separate guide to the components of research design. The steps below are the version you can apply directly to a correlational assignment.
Step 1: Choose one population and setting
A strong population statement includes who, where, and sometimes when.
Weak version:
“College students.”
Better version:
“Full-time first-year students at a community college during one semester.”
This matters because your sample and data collection method must match the claim. If your sample comes from one course, do not write as if your findings represent all university students.
Step 2: Write a neutral research question
Use this formula:
Is there a relationship between [Variable 1] and [Variable 2] among [Population]?
Examples:
Is there a relationship between weekly study hours and semester GPA among first-year biology students?
Is daily social-media use associated with perceived stress among undergraduate students?
Is roommate-conflict frequency related to sleep-quality scores among students in shared housing?
Avoid causal verbs: causes, affects, improves, reduces, increases, decreases, leads to. Those words imply a stronger design than correlation provides.
For more question patterns, see these research question examples for students.
Step 3: Create an operational-definition table
Before collecting data, write down exactly how each variable will be measured.
Variable | Operational definition | Scale | Timing | Likely measurement error |
|---|---|---|---|---|
Study time | Self-reported hours spent studying outside class in the past 7 days | Continuous | One survey | Recall error; inflated estimates |
GPA | Current semester GPA from self-report or records | Continuous | End of semester | Self-report inaccuracy; missing grades |
Stress | Total score on a perceived-stress questionnaire | Scale score | Same survey | Mood at survey time; social desirability |
Attendance | Percentage of class sessions attended | Continuous | Course records | Excused absences; record errors |
This table often saves the assignment. It exposes vague variables before they become vague methods.
Step 4: Choose a feasible sample and data-collection method
For a class assignment, convenience sampling is common. That does not make it representative. Say what it is.
Possible data sources include:
Anonymous student survey
Course records with permission and de-identification
Learning-management-system activity exports
Short validated questionnaire scales
Public or campus-level aggregate data, if appropriate
Handle sensitive data conservatively. Health symptoms, financial stress, grades, and mental-health measures require privacy protection. If your institution requires instructor approval or ethics review for human-subjects data, follow that process.
Step 5: Inspect the data before choosing the final test
Do not jump straight to Pearson correlation because it is familiar.
First check:
Scatterplot shape
Missing values
Outliers
Variable distributions
Whether each variable is continuous, ordinal, categorical, or count-based
Whether the relationship appears roughly linear
If the points form a curved pattern, Pearson correlation may miss the relationship. If the variable is ordinal or heavily skewed, Spearman may be better. If the goal is prediction while adjusting for other variables, regression may fit better.
If the assignment allows software support, Otio’s AI data visualization can help turn a CSV into scatterplots or simple charts while keeping the analysis tied to your uploaded data. Still verify the output and report the statistical method your course requires.
Step 6: Report association without overstating it
A basic correlational result should include:
Sample size
Direction of the relationship
Strength of the relationship
Statistical significance or confidence interval, if required
Practical interpretation
Limitation statement
A safe interpretation sounds like this:
“The results showed a positive association between weekly study hours and semester GPA. Students who reported more study hours tended to report higher GPAs. Because the design was correlational, the result does not show that increasing study hours would necessarily raise GPA.”
An unsafe interpretation sounds like this:
“Studying more caused students to earn higher GPAs.”
That sentence turns a correlational assignment into a causal claim.
Step 7: Use a title formula
Use this formula:
The Relationship Between [Variable 1] and [Variable 2] Among [Population]
Examples:
The Relationship Between Weekly Study Hours and Semester GPA Among First-Year College Students
The Relationship Between Social Media Use and Perceived Stress Among Undergraduate Students
The Relationship Between Caffeine Consumption and Sleep Quality Among Residential College Students
The Relationship Between AI-Tool Use Frequency and Writing Confidence Among First-Year Composition Students
If you are writing a longer paper, pair the title with a standard research-paper structure. Otio’s college research paper outline is useful for organizing the introduction, methods, results, and discussion.
A quick checklist for evaluating your chosen design
Use this checklist before submitting your topic proposal.
Both variables are measurable.
If you cannot explain how each variable becomes a number, score, rank, or category, the topic is not ready.
The research question matches correlation.
Use “relationship,” “association,” or “correlation.” Avoid “effect,” “impact,” and “influence” unless the instructor explicitly allows that wording for nonexperimental work.
The analysis matches the data type.
Pearson is not automatically the best choice. Spearman may fit ordinal or skewed data. Regression may fit prediction or adjustment for control variables.
The design names plausible third variables.
Good limitations mention confounders: motivation, prior GPA, workload, health, employment, socioeconomic factors, personality, course design, or access to resources.
Reverse directionality is considered.
If social media use and stress are correlated, either direction could be plausible. The same is true for caffeine and poor sleep, roommate conflict and sleep quality, and academic support visits and course GPA.
Sampling limits are stated.
A sample from one course, one campus, or one semester cannot represent all students.
Self-report bias is acknowledged.
Sleep, screen time, caffeine, stress, and study hours are often self-reported. That creates recall error and social-desirability bias.
Sources and measurement decisions are saved together.
Keep articles, notes, survey scales, variable definitions, and analysis decisions in one place. An AI research workspace like Otio can help store PDFs, web links, notes, and chats in a single project space while you draft the method section.
FAQ
Q: What is a simple example of correlational research?
A: A study examining whether weekly study hours are related to semester GPA is a simple correlational example. Both variables are measured, and no study schedule is assigned to participants.
Q: What is the difference between correlational and experimental research?
A: Correlational research measures naturally occurring variables, while experimental research manipulates an independent variable and typically uses comparison groups. Correlation can show an association, but an experiment is better suited to testing causal effects.
Q: Can correlational research use an independent and dependent variable?
A: Researchers may informally call one variable a predictor and another an outcome, especially in regression, but that labeling does not prove causation. In a correlational design, both variables are observed rather than experimentally controlled.
Q: Which statistical test is best for correlational research?
A: Pearson correlation is commonly used for two approximately continuous variables with suitable assumptions, while Spearman correlation is useful for ranked, ordinal, or nonnormally distributed data. Regression may be appropriate when predicting an outcome or adjusting for additional variables.
[[OTIO_FOOTER_PROMO:%7B%22title%22%3A%22Ready%20to%20test%20your%20own%20research%20question%3F%22%2C%22description%22%3A%22Add%20your%20articles%2C%20survey%20scales%2C%20and%20class%20notes%20to%20an%20Otio%20project%20to%20compare%20definitions%2C%20record%20limitations%2C%20and%20support%20your%20methods%20section.%22%7D]]