
Statistical Reporting
18 Statistical Reporting Checklists for Research Papers
Use 18 practical statistical reporting checklists to document study design, variables, effect sizes, confidence intervals, missing data, assumptions, and limitations. Match your paper with CONSORT, STROBE, PRISMA, or another appropriate reporting guideline.

If your statistical reporting is incomplete, reviewers will not just ask for “more detail.” They will question whether the analysis can be trusted. The fix is to choose the reporting guideline that matches your study design, then run a second, statistics-specific audit across design, sample, variables, models, missing data, effect sizes, uncertainty, software, and limitations.
Use this as a working set of 18 statistical reporting checklists. It does not replace CONSORT, STROBE, PRISMA, STARD, RECORD, or your journal’s instructions. It helps you make sure the numbers in the manuscript are traceable, interpretable, and internally consistent before submission.
Start by choosing the right statistical reporting checklist
The correct checklist depends on study design, analysis type, discipline, and journal requirements. It is not enough to say, “This is a quantitative paper.” A randomized trial, a cross-sectional survey, a diagnostic accuracy study, and a meta-analysis all need different reporting scaffolds.
A practical starting map:
Study type | Primary reporting guideline to check first | What it usually forces you to report |
|---|---|---|
Randomized controlled trial | CONSORT | Randomization, allocation, participant flow, outcomes, harms |
Observational cohort, case-control, or cross-sectional study | STROBE | Setting, participants, variables, bias, study size, statistical methods |
Systematic review or meta-analysis | PRISMA | Search, screening, eligibility, synthesis methods, study selection flow |
Diagnostic accuracy study | STARD | Index test, reference standard, accuracy estimates |
Routinely collected health-data study | RECORD, often alongside STROBE | Data sources, linkage, coding, data cleaning, access |
Trial protocol | SPIRIT | Planned design, outcomes, sample size, analysis plan |
A biomedical reporting review gives the same broad mapping: CONSORT for randomized trials, STROBE and RECORD for observational studies, STARD for diagnostic accuracy studies, PRISMA for systematic reviews and meta-analyses, and SPIRIT for randomized trial protocols (PMC). BMJ’s author guidance similarly points authors toward CONSORT, PRISMA, and STROBE by design type (BMJ Author Hub).
Use the official checklist early, not after the manuscript is “done.” At minimum, check it during:
Analysis planning, so the data structure and statistical decisions can be documented.
Manuscript drafting, so methods and results are written in the same order as the analysis.
Final submission, so the completed journal checklist matches the paper, tables, figures, and supplement.
The EQUATOR Network’s statistics reporting section is a useful place to find design-specific and analysis-specific guidance, including guidelines that focus on statistical methods and analyses. Always confirm the current official version and the target journal’s instructions before submission.

Study design, sample, and data collection checklists
Checklist 1 — Study design
A reviewer should be able to understand what kind of evidence the paper can and cannot support before seeing a single p-value.
Report:
The research question or hypothesis.
The design type: randomized trial, cohort, case-control, cross-sectional, qualitative-quantitative mixed design, diagnostic accuracy study, systematic review, meta-analysis, simulation, secondary analysis, or other design.
Whether data collection was prospective or retrospective.
The setting, including country, institution type, clinic, lab, school, database, registry, or online source.
The study period or data-extraction period.
Whether the analysis was exploratory, prespecified, confirmatory, or a mixture.
Whether the manuscript reports a primary analysis, secondary analysis, subgroup analysis, sensitivity analysis, or post hoc analysis.
If you are still choosing the design, start with a methods-level decision rather than a statistical test. This guide to research methodology types is useful background before you commit to a reporting checklist.
Checklist 2 — Participants and sample size
Statistical reporting breaks when the sample is described vaguely. “We analyzed 500 patients” is not enough unless readers know who those patients were, where they came from, who was excluded, and why that number was considered adequate.
Report:
Eligibility criteria.
Recruitment, sampling, or record-selection methods.
Inclusion and exclusion rules.
The number identified, screened, eligible, included, followed up, and analyzed.
Reasons for exclusions after eligibility.
Final analyzed sample size for each main analysis.
Subgroup sizes.
Cluster counts if the study used hospitals, schools, practices, families, classrooms, or repeated measures.
The basis for any power or sample-size calculation.
The assumed effect size, variance, alpha level, power, allocation ratio, attrition allowance, and software or formula used for the calculation, where applicable.
If no formal sample-size calculation was done, say so. Do not retrofit a justification after seeing the result.
Checklist 3 — Data collection and flow
Every analysis sample should be traceable. A flow diagram often does this better than prose.
Report:
How participants, records, studies, specimens, or observations moved from identification to final analysis.
Losses to follow-up, withdrawals, screening failures, exclusions, incomplete records, duplicate records, and failed measurements.
Reasons for missing observations where known.
Whether the analysis population differs from the recruited or eligible population.
Whether different outcomes used different denominators.
Whether any records were removed before statistical analysis.
For systematic reviews and meta-analyses, PRISMA explicitly uses a flow structure to report identification, screening, eligibility, and inclusion. A review of reporting guidelines notes that the PRISMA checklist contains 27 items and that the PRISMA flow chart should be embedded in reports (PMC). The official PRISMA 2020 checklist provides the current item structure and expanded explanations.

Variables, measurements, and data preparation checklists
Checklist 4 — Variable definitions
Ambiguous variables are a common source of statistical confusion. Define the variable before reporting the model.
Report:
Primary and secondary outcomes.
Exposures, predictors, treatments, interventions, mediators, moderators, and covariates.
Operational definitions for each variable.
Measurement time points.
Whether variables were continuous, ordinal, nominal, binary, count, time-to-event, repeated, or clustered.
Reference categories for categorical variables.
Direction of scales, especially when higher values could mean better or worse status.
Derived variables, such as change scores, ratios, composite scores, indexes, or risk scores.
Avoid phrases like “standard demographic variables were collected.” Name them. Age, sex, ethnicity, education, socioeconomic status, baseline severity, comorbidity score, and site are not interchangeable.
Checklist 5 — Measurement quality
A clean regression table cannot rescue poor measurement reporting. Readers need to know whether the numbers represent validated instruments, administrative codes, observer ratings, self-report, device outputs, or transformed fields.
Report:
Instrument, assay, questionnaire, device, rating scale, database field, or coding system.
Units and scale range.
Cut points and the source of those cut points.
Reliability or validity evidence when relevant.
Whether measurements were blinded to group, exposure, or outcome.
Who performed measurements when judgment was involved.
Training, calibration, adjudication, or duplicate-measurement procedures.
Inter-rater agreement methods if multiple observers coded the same construct.
For administrative or EHR-derived studies, define codes and extraction logic. If code lists are long, put them in the supplement.
Checklist 6 — Data preparation
Data preparation is analysis. If it changes the values used in the model, it belongs in the methods or supplement.
Report:
Transformations, such as log transformation, square-root transformation, winsorization, or z-scoring.
Standardization or normalization.
Outlier detection rules and whether outliers were removed, retained, capped, or analyzed separately.
Composite-score construction.
Reverse coding.
Category collapsing.
Date handling and follow-up-time calculation.
Duplicate handling.
Unit conversions.
Rules for removing observations before analysis.
Whether data-cleaning rules were prespecified or decided after inspection.
A useful standard is simple: another analyst should be able to reproduce the analytic dataset from the raw dataset using your description, code, and supplement.
Statistical methods and assumptions checklists
Checklist 7 — Test selection
Do not list statistical tests as if they were ingredients. Explain why each test or model fits the question and data.
Report:
The outcome type each test or model was used for.
Whether observations were independent, paired, clustered, repeated, or matched.
Why the selected model matches the design.
Whether the analysis estimates a difference, association, prediction, diagnostic accuracy, survival probability, or treatment effect.
Whether covariates were included for confounding control, precision, prediction, stratification, or design adjustment.
Whether the method handles unequal group sizes, non-normal data, clustering, censoring, repeated measures, or overdispersion when those issues exist.
Examples:
Use linear regression only when its scale and assumptions make sense for the outcome.
Use logistic regression for binary outcomes, but report effect estimates carefully because odds ratios can be misread as risk ratios.
Use Cox regression for time-to-event data only when the time origin, censoring rules, and proportional hazards assumption are addressed.
Use mixed-effects or generalized estimating equation models when observations are clustered or repeated and independence is not reasonable.
Checklist 8 — Model assumptions
Assumptions do not need a ritual sentence. They need evidence that the model was checked and that violations were handled.
Report the relevant checks for:
Linearity.
Independence.
Normality of residuals where relevant.
Homoscedasticity.
Proportional hazards.
Multicollinearity.
Influential observations.
Overdispersion.
Zero inflation.
Missing-at-random assumptions for imputation.
Random-effects structure in multilevel models.
Distributional assumptions in Bayesian models.
Also report what changed when assumptions were not met. Options may include transformation, robust standard errors, nonparametric methods, alternative link functions, different variance structures, sensitivity analyses, or a narrower interpretation.
Do not write “all assumptions were met” unless the paper explains how.
Checklist 9 — Multiple comparisons and model specification
Multiplicity problems often enter through side doors: many outcomes, many subgroups, many model variants, and many time points.
Report:
Number of primary and secondary hypotheses.
Number of outcomes and time points.
Number of subgroup analyses.
Number of models examined.
Any adjustment method used, such as Bonferroni, Holm, false discovery rate, or hierarchical testing.
Variable-selection procedure.
Interaction terms and whether they were prespecified.
Stopping rules or interim-analysis rules.
Whether analyses were prespecified, exploratory, post hoc, or sensitivity analyses.
Whether model formulas were chosen before or after seeing outcome results.
When no multiplicity adjustment is used, explain why. In exploratory analyses, the better move is often to label the analysis clearly and avoid overclaiming.
[[OTIO_INLINE_PROMO:%7B%22title%22%3A%22Need%20to%20verify%20your%20model%20assumptions%3F%22%2C%22description%22%3A%22Add%20your%20reporting%20guidelines%2C%20protocol%2C%20and%20analysis%20notes%20to%20Otio%20to%20compare%20required%20checks%20and%20document%20how%20assumption%20violations%20were%20handled.%22%7D]]
Descriptive statistics and result reporting checklists
Checklist 10 — Descriptive statistics
Descriptive statistics are not filler. They tell readers whether the sample is plausible, whether groups are comparable enough to interpret, and whether model results rest on thin cells.
Report:
Sample size for every table and analysis.
Counts and percentages for categorical variables.
Mean and standard deviation for approximately symmetric continuous variables.
Median and interquartile range for skewed continuous variables.
Minimum and maximum when range is important.
Units for each variable.
Denominators for percentages.
Missing values by variable, not just overall.
Whether percentages are column percentages, row percentages, or total percentages.
Weighted estimates if survey weights were used.
Do not mix denominators silently. If 42% means 42 of 100 in one row and 42 of 87 in another, the table should make that visible.
Checklist 11 — Group comparisons
Baseline and group-comparison tables are easy to overinterpret. A nonsignificant baseline test does not prove groups are equivalent, and a significant baseline difference in a randomized trial does not by itself prove bias.
Report:
Group characteristics using the same format across groups.
Group sample sizes.
Descriptive differences separately from inferential comparisons.
Standardized differences where common in your field.
Whether baseline tests were required by the journal or included for context.
Whether imbalance was handled in adjusted analyses.
Whether subgroups were large enough for meaningful interpretation.
Guidance in the American Journal of Respiratory and Critical Care Medicine notes that STROBE structures observational results around participant eligibility and data availability, descriptive characteristics, outcome summaries, primary statistical analysis, and additional analyses such as sensitivity or exploratory analyses (Oxford Academic). That order is useful beyond respiratory medicine: first show who was analyzed, then what the data looked like, then what the model estimated.
Checklist 12 — Statistical significance
Statistical significance is a reporting convention, not a measure of importance.
Report:
Exact p-values when appropriate.
The significance threshold.
Whether tests were one-sided or two-sided.
Whether p-values were adjusted for multiple comparisons.
Which results were primary and which were secondary.
Whether p-values came from Wald tests, likelihood-ratio tests, permutation tests, rank tests, bootstrap methods, or another procedure.
Whether statistical software defaults affected the reported value.
Avoid:
“No difference” when the result is merely not statistically significant.
“Trend toward significance” as a substitute for reporting the estimate and interval.
Treating p < 0.05 as proof of practical, clinical, or policy importance.
Reporting “p = 0.000.” Use a format such as p < 0.001 if that matches your journal style.
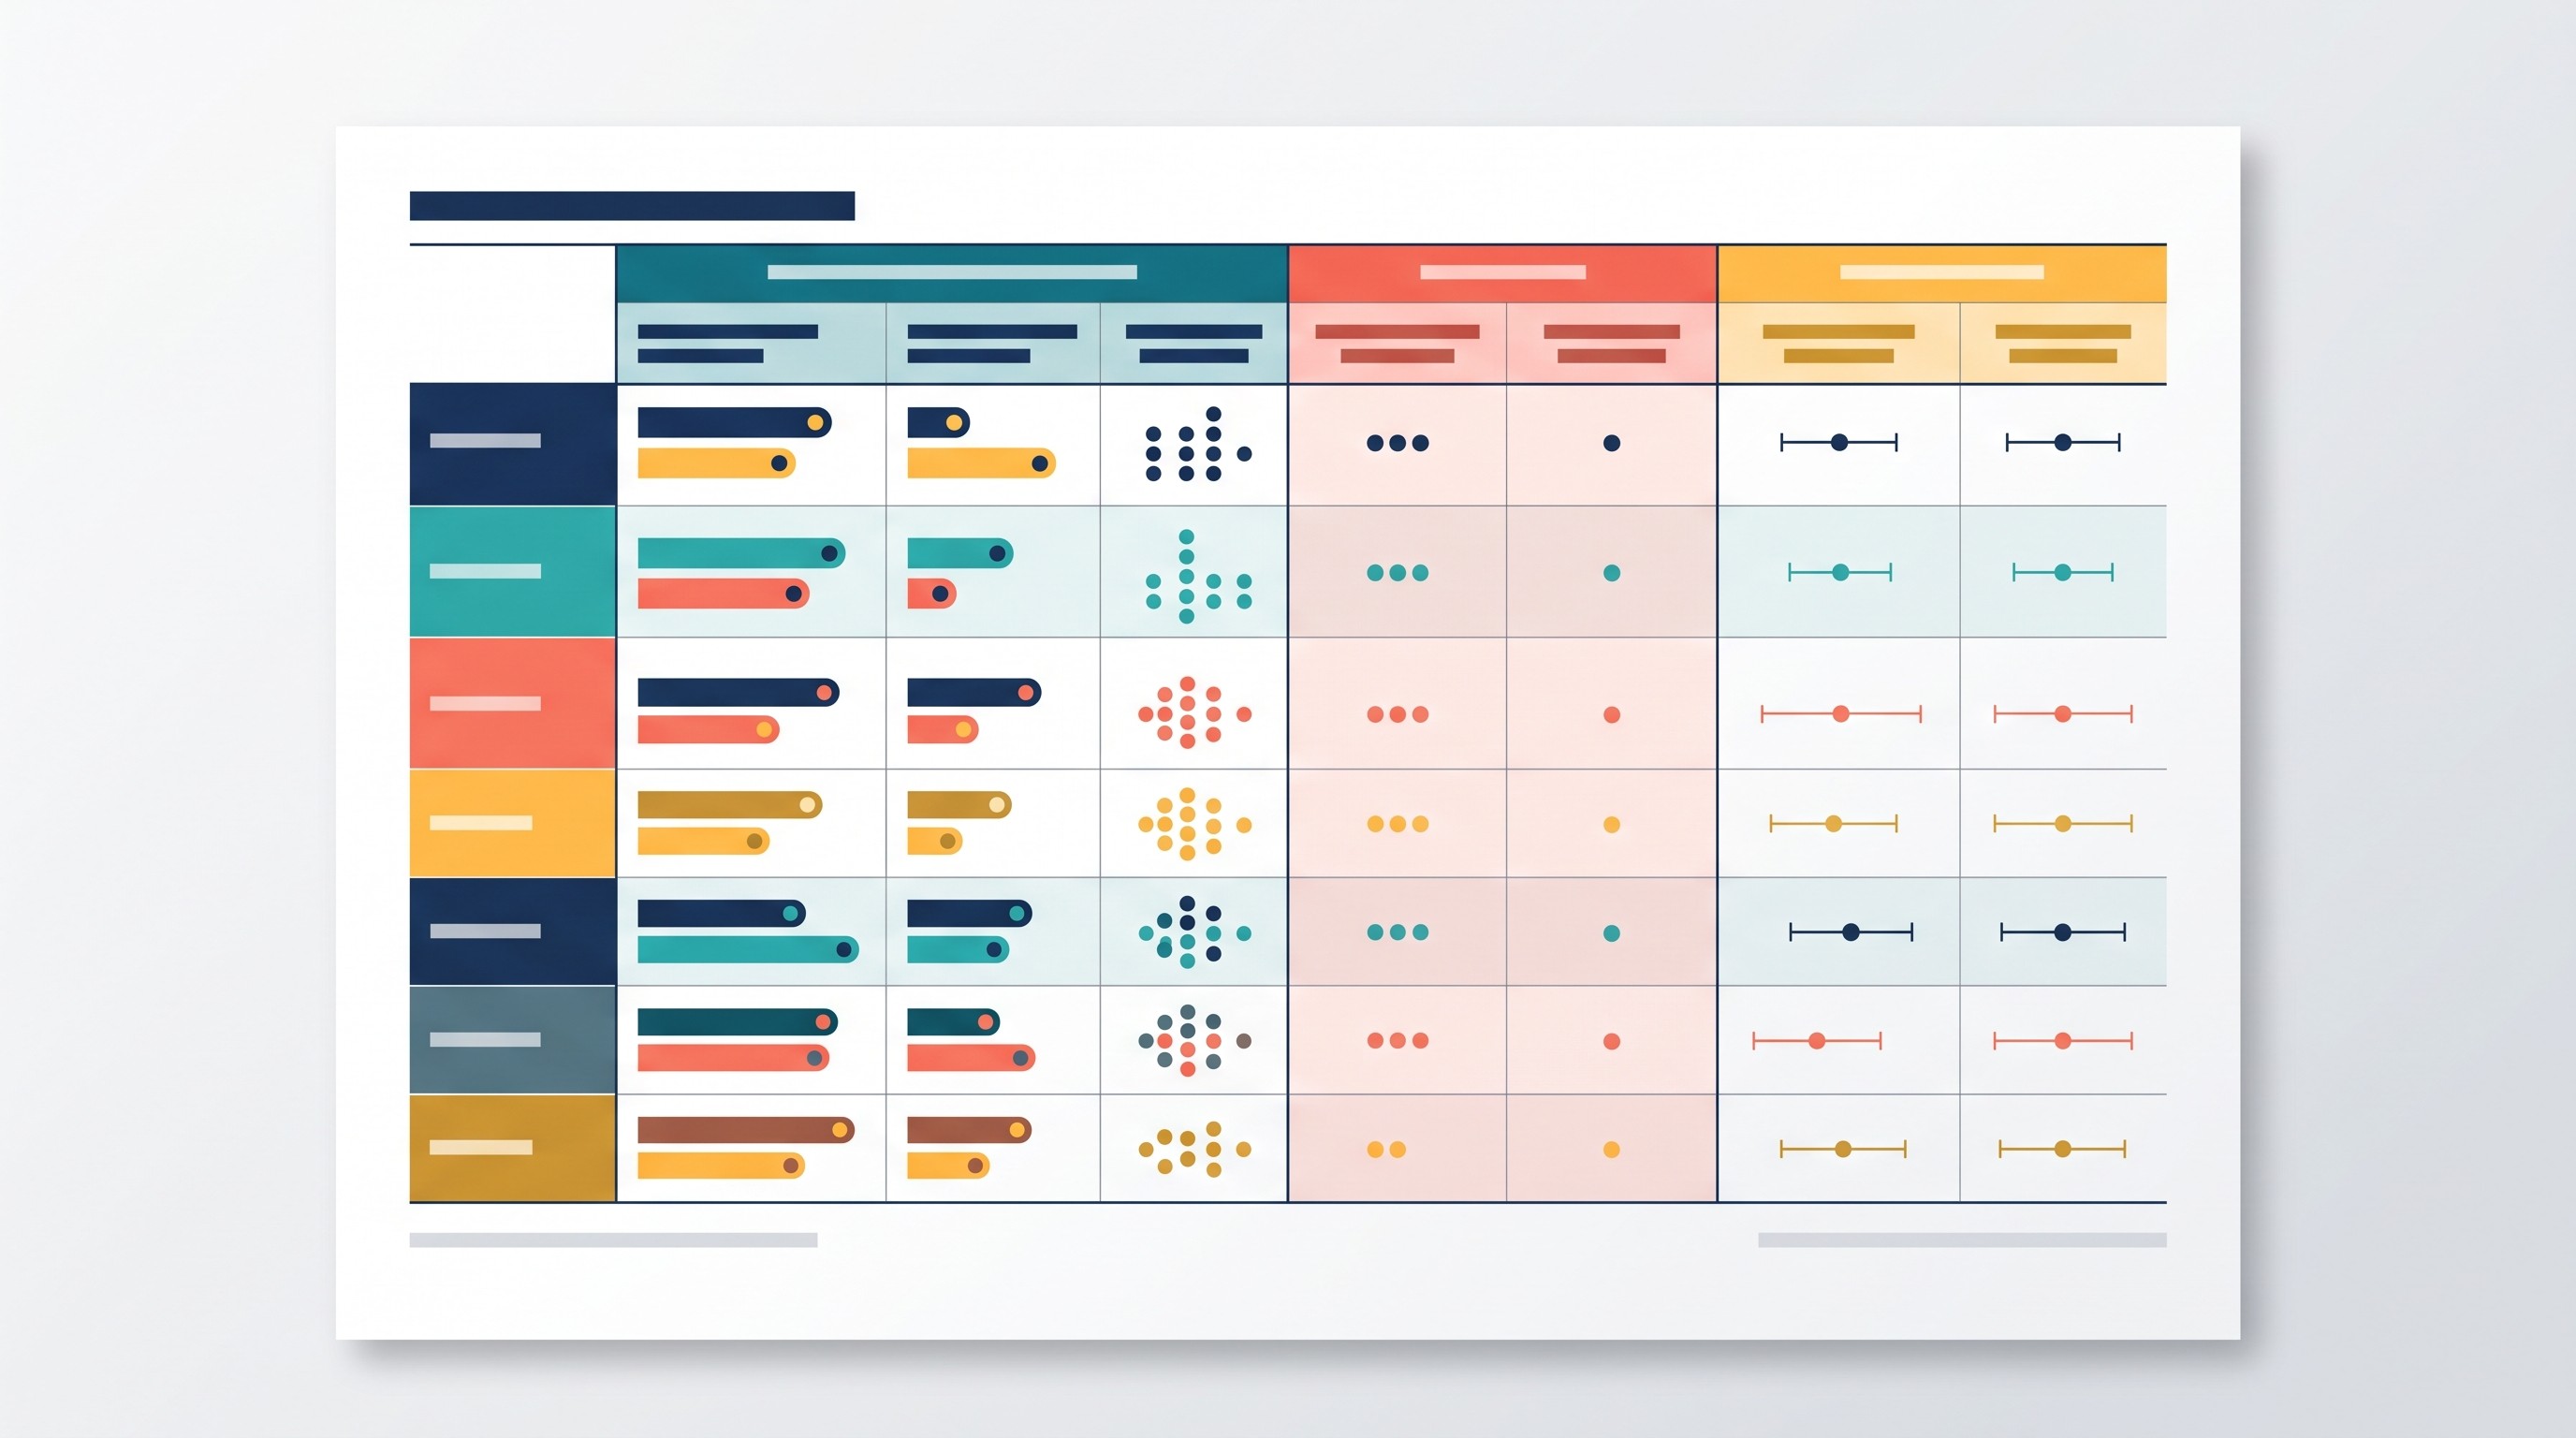
Effect sizes, confidence intervals, and visualizations checklists
Checklist 13 — Effect sizes
The effect estimate should answer the research question. If the question is “How much higher?” the answer is not just “p = 0.03.”
Report the appropriate estimate, such as:
Mean difference.
Standardized mean difference.
Median difference.
Risk difference.
Risk ratio.
Odds ratio.
Hazard ratio.
Incidence rate ratio.
Correlation.
Regression coefficient.
Marginal effect.
Area under the curve.
Sensitivity and specificity.
Number needed to treat or harm, where appropriate.
Also report the scale. A coefficient per one-unit increase may be uninterpretable if one unit is tiny. Consider reporting per clinically meaningful unit, per standard deviation, or across a meaningful contrast when justified.
Checklist 14 — Confidence intervals and precision
Confidence intervals communicate precision and a range of values compatible with the estimate under the model. They are not decorations after the p-value.
Report:
Confidence intervals for key effect estimates.
The confidence level, commonly 95% unless another level is justified.
Whether intervals are unadjusted, adjusted, bootstrapped, robust, profile-likelihood, Bayesian credible intervals, or another type.
Enough decimal places to support interpretation.
Consistent precision across text, tables, and figures.
Wider uncertainty for subgroup or sensitivity analyses where sample sizes are smaller.
A simple rule: if the estimate matters enough to discuss in the abstract or conclusion, it usually deserves an interval.
Checklist 15 — Tables and figures
Tables and figures should be understandable without forcing the reader to search the methods section every ten seconds.
For each table or figure, report:
Clear title or caption.
Population or analysis sample.
Denominators.
Units.
Group labels.
Time points.
Effect estimates.
Confidence intervals or other uncertainty measures.
p-values only where they add value.
Notes explaining abbreviations.
Whether estimates are adjusted or unadjusted.
Variables included in adjusted models.
Missing-data handling if it affects the displayed result.
Reference category for categorical predictors.
Null reference line in forest plots.
Scale transformations, such as log scale.
For broader manuscript mechanics, this guide to writing research papers pairs well with a statistical audit because it covers structure, clarity, and revision beyond the numbers.

Missing data, reproducibility, and limitations checklists
Checklist 16 — Missing data
Missing data should be reported as a property of the dataset, not treated as an inconvenience hidden in the software output.
Report:
Amount of missing data by variable.
Missingness by group or exposure where relevant.
Missing outcome data separately from missing covariate data.
Known reasons for missingness.
Whether complete-case analysis, available-case analysis, single imputation, multiple imputation, weighting, maximum likelihood, or another method was used.
Variables included in the imputation model.
Number of imputations, if applicable.
Whether imputed outcomes were used.
Diagnostics or plausibility checks for imputation.
Sensitivity analyses for different missing-data assumptions.
Differences between included and excluded participants or records.
Do not just state, “Missing data were handled by multiple imputation.” Readers need to know what was imputed, how, using what variables, and whether conclusions changed.
Checklist 17 — Reproducibility
Reproducibility does not require sharing private data publicly. It does require enough documentation for another qualified reader to understand the analysis path.
Report:
Statistical software name and version.
Packages, libraries, procedures, or modules.
Model syntax or enough formula detail to reconstruct the model.
Random seeds for simulations, resampling, cross-validation, or imputation where relevant.
Data-access restrictions.
Where code, materials, preregistration, protocol, supplements, or analytic datasets can be accessed.
Deviations from the protocol or analysis plan.
Version dates for external datasets.
Any manual coding or adjudication steps.
File formats and variable dictionaries where data are shared.
If the project has many PDFs, guideline forms, journal instructions, notes, and references, use a single research workspace instead of scattering the audit across downloads and chat transcripts. Otio’s AI PDF reader can keep guideline PDFs and manuscript sources in one library, and the Zotero integration can help bring reference material into the same workspace. Still verify every statistical statement against the original guideline, article, dataset, or analysis output.
For data governance, file naming, documentation, and access control, this guide to research data management covers the surrounding workflow.
Checklist 18 — Interpretation and limitations
The discussion should match what the design and analysis can support. This is where statistically correct papers often become overstated papers.
Report:
Whether findings support association, prediction, description, diagnosis, or causal inference.
Whether causal language is justified by design and assumptions.
Magnitude and direction of effects.
Practical, clinical, educational, policy, or theoretical importance.
Uncertainty around estimates.
Generalizability limits.
Measurement error.
Selection bias.
Residual confounding.
Low power or sparse data.
Model misspecification.
Multiplicity.
Missing-data sensitivity.
External validity.
Whether subgroup results are exploratory.
Whether findings are robust across sensitivity analyses.
A useful final check: remove every p-value from the conclusion. If the claim no longer makes sense, the interpretation probably depends too much on statistical significance and not enough on effect size, design, and uncertainty.
Final pass: turn the checklist into a submission-ready audit
A checklist only works if it becomes a manuscript audit. Create a table with one row per item and assign ownership.
Audit item | Manuscript location | Responsible author | Status |
|---|---|---|---|
Study design named and justified | Methods, paragraph 1 | Lead author | Done |
Eligibility criteria complete | Methods, participants | Clinical author | Check |
Sample size calculation reported | Methods, statistics | Statistician | Missing |
Missing data by variable shown | Table 1, supplement | Analyst | Check |
Effect sizes and confidence intervals consistent | Abstract, Results, Tables 2–3 | Lead author | Done |
Software and package versions named | Methods, statistics | Analyst | Missing |
Then cross-check every numerical claim across:
Abstract.
Main text.
Tables.
Figures.
Supplement.
Reporting-guideline form.
Trial registration, protocol, or review registration where applicable.
Statistical code or output.
Journal submission metadata.
Look especially for mismatches in sample size, denominators, p-values, confidence intervals, model adjustment, subgroup sizes, and rounding. These are the small inconsistencies that make reviewers wonder what else is wrong.
A good final workflow:
Choose the official guideline for the study design.
Create the 18-item statistical audit table above.
Assign each item to the author who can verify it.
Trace every key number from manuscript to output.
Check consistency across abstract, text, tables, figures, supplement, and checklist.
Label exploratory analyses clearly.
Verify limitations against the actual design and model.
Submit the completed reporting checklist required by the journal.
If the paper still feels hard to audit, the problem is usually not the checklist. It is the analysis record. Put the protocol, code, output, tables, figures, journal instructions, and source papers in one place before the next revision cycle.

FAQ
Q: Which statistical reporting checklist should I use for my research paper?
A: Choose the guideline that matches your study design and target journal. CONSORT is commonly used for randomized trials, STROBE for observational studies, and PRISMA for systematic reviews and meta-analyses.
Q: Do I need to report both p-values and confidence intervals?
A: Usually, yes for key inferential results. P-values address compatibility with a null model, while confidence intervals communicate estimate precision and plausible values.
Q: What should I report when data are missing?
A: Report how much data are missing, where the missingness occurs, why it may have occurred if known, and how the analysis handled it. Describe imputation methods or complete-case rules and include sensitivity analyses when appropriate.
Q: Can a reporting checklist replace statistical review?
A: No. A checklist improves transparency and completeness, but it does not establish that the design, analysis, assumptions, or interpretation are statistically valid.
[[OTIO_FOOTER_PROMO:%7B%22title%22%3A%22Ready%20to%20audit%20your%20own%20manuscript%20sources%3F%22%2C%22description%22%3A%22Bring%20your%20manuscript%2C%20journal%20instructions%2C%20code%20output%2C%20and%20checklist%20into%20one%20Otio%20library%20to%20trace%20numbers%20and%20spot%20inconsistencies%20before%20submission.%22%7D]]